
Learn how to read and use forex data, as well as the various types and the ways that quality data can transform your trading strategies.
Whether it’s hourly, weekly, monthly, or tick data, reliable forex data can be the difference between success and failure. Professional traders use it to backtest strategies and developers use it to build complex trading algorithms, but as this guide shows, you don’t need to be an expert to acquire and utilize forex trading data.
Content
Trade forex with an edge
Experience better-than-market conditions. Try live or demo.
Key takeaways
- Forex data includes all market-related information. It covers datasets, charts, and graphs that represent currency price movements in the foreign exchange (forex) market.
- Forex data comes in different forms. Common examples include real-time prices and historical data used for analysis.
- Traders use forex data to identify opportunities. Analyzing patterns helps determine potential entry and exit points.
- Forex trading data is widely accessible. You can download it from trusted websites or access it through trading platforms.
- Forex data supports informed trading decisions. Using market data helps traders understand price behavior and test strategies before trading live.
What is forex data?
Forex data refers to the information pertaining to the foreign exchange market. It includes a broad spectrum of data that can be categorized into various types and subtypes. The most common types of data in forex include:
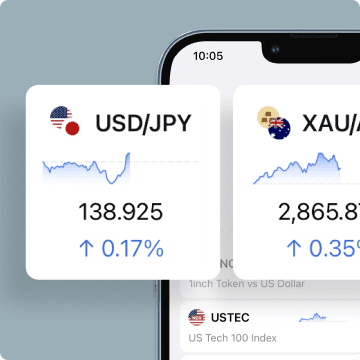
Currency exchange rates
This is simply the current values of a currency pair, updated in real-time. For example, at the time of writing, GBPUSD has a “Buy” price of 1.31692 and a “Sell” price of 1.31682.
The price will update as the market fluctuates, and you can monitor it through a trading platform like the Exness Terminal.

Tick data
Tick data records every price change, including the bid and ask price, as well as a timestamp. You can download tick forex data from the Exness Tick History page.
If you download the data from USDJPY on 11 November 2025, you’ll see a long CSV file that begins as such:
Symbol | Timestamp | Bid | Ask |
USDJPY | 2025-11-11 00:00:00.022Z | 154.146 | 154.153 |
USDJPY | 2025-11-11 00:00:00.073Z | 154.144 | 154.151 |
Exness offers extensive tick data for many forex pairs. All files are in CSV format and compressed into a ZIP file.
Historical forex data
Historical data covers specific time periods, with prices recorded in minute, hour, day, week, or month intervals. These datasets can be extensive and are available for download or as a feed. While many free downloads are available, data brokers often charge traders a premium rate for this information.
Historical forex data is a helpful tool for reviewing how previous events impacted a specific currency pair or for backtesting trading strategies.
For example, data from 1 January 2020 to 1 January 2021 could provide insights into how the market reacted to global lockdowns. If we input those parameters for EURUSD, and select a one-day timeframe for the “Bid” price, it begins as follows:
Timezone: Europe/London | Open | High | Low | Close | Volume |
01.01.2020 00:00:00 UTC+00:00 | 1.1212 | 1.12218 | 1.12106 | 1.12188 | 2621.32 |
02.01.2020 00:00:00 UTC+00:00 | 1.12188 | 1.12245 | 1.11635 | 1.11708 | 487219.118 |
“Timezone” shows that the entries were made daily at midnight. The open/high/low/close (OHLC) shows the price at the start/end of the day, as well as the highest/lowest points, while “Volume” displays the number of price changes.
Technical forex data
If you’re looking at huge data files with a view to studying the market, finding patterns, and plotting strategies, you’re conducting what’s known as a technical analysis.
This is commonly used for currency pairs and looks for repeatable patterns and trends. There are various factors behind each market fluctuation, but given enough time, those fluctuations often repeat.
Traders use indicators to help them find these patterns, including the relative strength index, which identifies overbought and oversold conditions to measure momentum, and moving averages, which calculate the average price.
Fundamental forex data
Fundamental forex trading data measures a currency’s intrinsic value using information such as a country’s GDP, employment data, and interest rate announcements.
For example, if Japan announces strong economic data (higher GDP, lower unemployment, etc.) compared to other major nations, the value of the Japanese yen may increase against those other currencies.
Common forex data formats and how to read them
Forex data comes in multiple formats, focusing on simple, easy-to-read data that allows for huge inputs without creating oversized files. The most common formats include CSV and JSON, but traders can also view forex data in the form of charts and APIs.
Flat data files
CSV, which stands for comma-separated values, is the most common format for forex data. You can view exchange rate data from CSV files in spreadsheet programs like Microsoft Excel and Google Sheets.
If you have Excel installed on your computer, simply double-click on the file to open it. Otherwise, open Google Sheets, click “New > Import”, select the file, and view the imported data.
Structured data files
Complex datasets provided by premium-rate services are often available via an API. Traders can then access the data using their preferred trading program.
To use an API, sign up for a data broker service and get the API key. You can then check the service’s documentation to learn how to read and utilize the data before creating a request URL using your API key. Check the provider’s help files for more information.
Proprietary data files
Proprietary forex data files can only be read by the program that created them, such as the FXT extension used by MetaTrader 4.
You can view extensive forex data on most top trading programs. For MetaTrader 4, check the “History Center” via the “Tools” menu. For MetaTrader 5, click “View > Symbols”.
In addition to currency pairs, these platforms offer a wealth of data on other trading instruments, including commodities like precious metals (gold and silver).
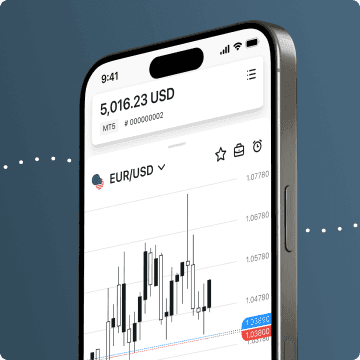
Forex charts
A forex chart is a convenient and commonly used form of forex data that represents past data and real-time prices in a visual and digestible format.
To understand how to read data in forex charts, let’s use an EURUSD candlestick chart as an example:

In the top left, you’ll see the current timeframe, set to “1m” for one minute, with timestamps along the bottom and prices down the right. In the middle, we have candlesticks representing the prices during these times.
Candlesticks aren’t the only way to view this information, but they are one of the most common. A single candlestick represents each timeframe (one minute). Blue candles indicate that the price increased; red candles indicate that it decreased. The size and shape display specific price information:
- Open: The bottom of the blue and the top of the red.
- Close: The top of the blue and the bottom of the red.
- High: The top wicks.
- Low: The bottom wicks.
Learn more about these charts in our guide to candlestick chart patterns.
How to use forex trading data as a beginner
Quality data supports reliable trading strategies, but it won’t do all of the work. You need to know how to read and use that data. So, if you’re new to forex trading, here are some tips for utilizing forex trading data:
Start with major currency pairs
The more popular the trading instrument, the more data you’ll find. High-volume currency pairs also offer greater liquidity and may be less volatile. Good examples include USDJPY, EURUSD, USDCAD, and GBPUSD.

Analyze data using forex charts
While good data makes a big difference, it’s not the only factor. Paying companies a premium rate for aggregated data won’t guarantee success. If you can’t read the markets and don’t know the basics, it likely won’t make a difference.
To begin, stick with forex data charts available through platforms like MT4, MT5, the Exness Terminal, and the Exness Trade application.
Trade using a demo account
Before you jump in with real money trades, familiarize yourself with the process using a demo account. Visit our demo trading account page to get started.
Spend some time with the demo to reach a point where everything feels familiar and normal rather than confusing and overwhelming. Change the display and trading settings to suit your preferences, place a few trades to get used to the process, and test various strategies.
Get more information for your trading strategies using our trading calculator and economic events calendar.
Refine your strategy using advanced forex data
Once you’re more comfortable with the trading process, it’s time to grab some high-quality data. Always use reliable and verifiable sources, looking out for inaccuracies, gaps, and corruptions.
Look for free data first, and if you’re ready to pay for quality datasets, read data broker reviews to ensure that you’re paying for extensive, quality data that you can’t get for free.
Adopt risk management strategies
Protect your trades with stop loss and take profit orders, which automatically settle your trades when they reach a predetermined price. You won’t need to constantly watch your trades, but the main benefit is that you can assign values based on your trading goals and manage multiple open trades with reduced risk.

Trading glossary
Forex Data
Forex data refers to all information related to the foreign exchange market, including real-time prices, historical data, charts, and volume. Traders use forex data to analyze currency movements, identify patterns, and determine trading strategies across forex pairs such as EURUSD, GBPUSD, and USDJPY. Reliable forex data is essential for understanding market behavior and making informed trading decisions.
Historical Data
Historical data is forex trading data that shows past prices and volume over specific timeframes, such as hourly, daily, or monthly. This data allows traders and developers to backtest strategies, study market reactions to events, and compare the performance of currency pairs like EURUSD or the Japanese yen during earlier periods. Historical data is often available as free downloads or through paid services.
CSV (comma-separated values) Format
The CSV format is a common data file format used to store forex data in a simple, structured way. Each line in a CSV file represents an entry, such as an exchange rate, timestamp, or volume, making it convenient to import into applications like Excel, Google Sheets, or trading platforms. Many traders download forex data in CSV format because it is lightweight, reliable, and easy to read.
Trade the world's top currencies with Exness
Get tight and stable spreads on every currency trade.
Final thoughts
Forex data is the foundation of informed forex trading, whether you’re tracking real-time prices, reviewing historical data, or working with data files in multiple formats like CSV. By learning how to access, read, and apply reliable forex trading data, traders can better understand market behavior, identify patterns, and backtest strategies with greater confidence. From major forex pairs such as EURUSD, GBPUSD, and USDJPY, to broader market indicators, high-quality data helps reduce uncertainty, manage risk, and enable more disciplined trading decisions.
Frequently asked questions
What is forex data?
Forex data includes real-time prices, historical data, and charts that show how currency pairs move in the market. Traders use this data to analyze patterns and support forex trading decisions.
Where can I download forex trading data?
You can download forex data from trading platforms, broker websites, and data services. Some offer free historical data in CSV format, while others provide paid, aggregated datasets.
What formats does forex data come in?
Forex data is available in multiple formats, including CSV (comma-separated values), APIs, and platform-specific files used by trading applications such as MetaTrader.
Share:
Related


Exness Trade app
Trade with confidence anytime, anywhere.


Get the app
App title

Trading is risky. T&Cs apply.


