
Studying interest rates, GDP data, and economic indicators falls under the umbrella of forex fundamental analysis. It differs from the price-focused technical analysis, but oftentimes, the best approach is to incorporate both methods. Here’s how to get the most from a technical and fundamental analysis in forex.
Technical and fundamental analysis are the two main approaches used in forex trading. One focuses purely on price charts; the other takes a more fundamental view and considers the external influences impacting those prices. Both can be effective, and the best one to use depends on a trader’s preferred trading style and approach.
In this guide, we’ll discuss how to use both technical and fundamental analysis in forex, how they differ, and outline their pros and cons.
Content
Key takeaways
- Fundamental analysis evaluates economic value. It's valuable for forex traders to assess how interest rates, GDP, and other economic factors influence currency prices across the wider economy and foreign exchange markets.
- Technical analysis focuses on price action. This type of analysis uses charts, patterns, and indicators to help traders identify short-term opportunities in forex trading, especially during high-risk market conditions.
- Fundamental traders monitor the wider economy. By studying economic data and developments across financial markets, they use fundamental analysis to estimate long-term currency value and market direction.
- Both methods can support better decisions. Many forex traders combine forex fundamental analysis and forex technical analysis to account for both external factors and chart-based signals.
- The best approach depends on strategy. Technical analysis may suit short-term trading, while fundamental analysis can be more effective for understanding what is creating long-term value in the economy.
Make smarter trading decisions
Use expert analysis and tools on demo accounts or a live account.
What is fundamental analysis in forex?
The goal of a fundamental analysis is to determine an asset’s fair value and judge its current and future strength. It dissects the economic indicators that play a role in a country’s economy and, by extension, how they could predict the direction of a particular currency pair.
For example, suppose the Bureau of Economic Analysis announces lower-than-expected GDP growth. Investors may respond by withdrawing support for the US dollar, which will then impact USD currency pairs such as EURUSD and USDJPY.
Conversely, if the Fed announces higher interest rates, the US becomes more attractive to foreign investors, driving up the dollar’s value.

Fundamental data and where to find it
Fundamental traders study economic conditions, looking for any data that could impact currency prices. The data itself isn’t always the catalyst. If word spreads that a central bank is considering raising interest rates, that could be enough to affect forex pairs involving that country’s currency.
Type of economic data | Publisher(s) | What it includes | Typical effects on the forex market |
Gross domestic product (GDP) data | National statistical agencies, such as the Bureau of Economic Analysis in the US.
| Figures showing the GDP growth rate. | Stronger-than-expected GDP growth often leads to support for that country’s currency. Weaker-than-expected growth may reduce risk appetite. |
Central bank decisions | Central banks, such as the Bank of England, the US Federal Reserve, and the European Central Bank. | Mainly interest rate adjustments, but also financial policies like quantitative easing. | Higher interest rates often lead to positive currency growth. Lower interest rates adversely affect the currency’s price. |
Inflation rates | National statistical agencies. | Price data for inflation measures, often based on the Consumer Price Index (CPI) and Personal Consumption Expenditures (PCE). | High inflation has a negative effect. Low inflation drives economic growth. |
Employment figures | Labor/statistical agencies, such as the Bureau of Labor Statistics in the US. | Increases/decreases in unemployment rates. | Low unemployment stimulates growth. High unemployment may adversely impact market sentiment. |
Trade data | National and international organizations, including the US Census Bureau and the World Trade Organization. | Trade surpluses, tariffs, and other import/export data. | The trade balance is often key; a surplus may strengthen the currency, while a deficit can weaken it. |
Pros and cons of a forex fundamental analysis
Fundamental analysis offers insights into broader financial markets, helping traders understand the driving forces behind uptrends and downtrends. With the right data and a solid understanding of how it impacts the foreign exchange market, fundamental analysts can speculate on future prices to make informed decisions.
It’s especially effective at evaluating long-term trends, as economic data can indicate whether a country, and therefore its currency, is in a period of growth or decline.
However, it’s not the most effective analytical method for short-term trading. It’s time-consuming with various influencing factors and lots of data to consider. What’s more, many of the outcomes are subjective.
Even a novice trader can predict that sharp increases in unemployment combined with increased inflation are bad for an economy, but the data isn’t always that clear-cut. For example, it’s difficult to judge how trade tariffs will impact an economy, and the same is true for natural disasters and pandemics.
Sometimes, market sentiment remains strong in the face of an apparent economic crisis.
For example, in 2025, the US dollar remained relatively stable after President Donald Trump announced a series of trade tariffs, with the currency only fluctuating after reciprocal tariffs were announced. The situation changed on 2 April 2025, when President Trump announced sweeping tariffs, and significant volatility followed. The stock market responded with a major sell-off that wiped 10.5% off the S&P in two days, and the US dollar weakened.

What is a forex technical analysis?
In technical analysis, traders focus solely on historical price data, believing that everything they need to know about a currency pair is in that data. They are not dismissing fundamental factors entirely, and simply believe that all price movements, as well as the factors that drive them, can be seen in historical charts.
Technical forex traders look for repeating patterns and trends within the data. In simple terms, while the forex market is complicated, it ultimately only moves in one of three directions: upwards, downwards, or horizontally—and with the right data and several indicators, traders can speculate on where it will move next.
Learn more in our guide to technical analysis.
Technical data and the global markets
Technical forex traders start with high-quality forex data, such as downloadable tick data or the historical data built into trading platforms. Then they might use candlestick charts and trend lines to get a clear picture of market direction.
From there, traders can use a series of technical indicators to make sense of the data, such as confirming trend momentum by checking volume or identifying overbought and oversold conditions.
Candlestick charts and patterns in forex technical analysis
Candlestick charts use “candles” to represent all price action within a specified timeframe. Bullish candles (usually green, blue, or white) depict the open price at the bottom of the body and the closing price at the top. Bearish candles (red or black) show the open at the top and close at the bottom. In both cases, upper wicks represent the high price while lower wicks represent the low price.
Candlestick charts can be used to identify patterns formed from two or more candlesticks. These recognizable patterns reveal specific bullish or bearish intent, indicating where the market might be headed.
Common candlestick patterns used in forex technical analysis include:
- Bullish engulfing pattern: A pattern formed by two candlesticks, with the first bearish candle completely engulfed by a subsequent bullish candle (opens below the lowest point of the preceding candle and finishes above the highest point). It indicates strong buying pressure and a shift from bearish to bullish.
- Bearish engulfing pattern: As above, but the smaller candle is bullish and engulfed by a larger, bearish candle, suggesting a move from bullish to bearish.
- Doji candles: Flat body candles that are formed at the top or bottom of a prevailing trend that usually act as early reversal signs.
- Morning star: A short-bodied candle sitting between longer bullish and bearish candles, indicating that previous selling pressure has faded and a reversal is due.

Incorporating trend lines into a trading strategy
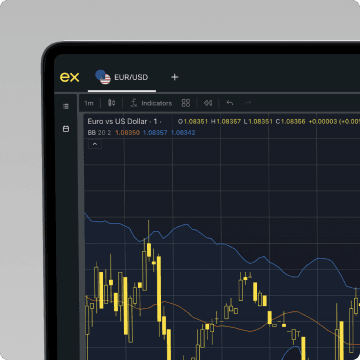
Trend lines reveal a clear market direction. Traders can draw them onto price charts using most trading software (as seen below in the Exness Terminal) by connecting at least two consecutive higher lows for bullish trends and two consecutive lower highs for bearish trends.
Support and resistance levels also help traders to define a common range. These lines show where uptrends or downtrends commonly face resistance and bounce back. Support lines sit across the lows and show where sellers are overwhelmed by buyers; resistance lines form across the highs and signal where buyers meet resistance.
Once they define this range, technical traders may try to trade within it, known as “range trading”, or look for moments when those lines break to create new trends, known as “breakout trading”.

Technical indicators in forex trading
Technical indicators are important analytical tools that help interpret a chart’s price action, providing traders with valuable information to plot future trends. These tools are built into popular trading platforms (click “Indicators” on the Exness Terminal) and overlay information directly on a pricing chart.
Some of the most common technical indicators include:
- Moving averages: Calculate the average price over a given session, smoothing out short-term volatility and giving traders a clearer view of broader market trends.
- Exponential moving averages: EMAs are similar to moving averages, but with more weight added to recent price action. Prices above the line are bullish; prices below are bearish.
- Relative Strength Index: The RSI is an oscillator that uses a scale from 0-100 to identify overbought (over 70) and oversold (under 30) conditions.
- Bollinger Bands: This indicator uses three lines. The middle line is a moving average, while the others are two standard deviations above and below. If the price tests the upper line, it suggests the market is overbought. If it tests the lower line, it may be oversold.

Pros and cons of a forex technical analysis
Technical analysis is ideally suited to short-term forex trading. Traders can quickly analyze the market, speculate on future developments, and then trade accordingly. In such a highly volatile and fast-moving market, this speed is key.
However, it’s far from flawless, mainly because the higher the volatility, the more likely you are to see false signals, and it takes a lot of practice and experience to learn how to identify them.
It also completely ignores aspects of fundamental trading. If a technical trader sees a positive buy signal at the same time that a report shows negative GDP or employment data, they could jump in just as everyone else is scrambling to get out.
The best approach is to adopt elements of both technical and fundamental analysis, accounting for fundamental changes resulting from central bank policies and geopolitical events while also studying historical price charts and identifying patterns.
Trading glossary
Fair value The estimated true value of a currency, based on economic factors rather than the current market price. Fundamental traders use it to assess whether a currency may be overvalued or undervalued.
Quantitative easing (QE) A monetary policy where a central bank injects money into the economy to stimulate growth. It can affect interest rates, currency value, and broader financial markets.
Volatility A measure of how much and how quickly prices move in the foreign exchange market. Higher volatility often increases both opportunity and risk when trading forex.
Market sentiment The overall mood or attitude of traders toward a currency or the wider economy. Sentiment can influence price movements even when economic data suggests otherwise.
Reciprocal tariffs Trade restrictions imposed by one country in response to tariffs from another. They can impact the economy, trade flows, and currency value.
Tick data Detailed price data showing every market movement in real time. Forex traders may use tick data in technical analysis to study short-term price behavior.
Risk appetite Investor’s willingness to take on higher-risk positions in financial markets. A strong risk appetite can support demand for certain currencies, while a weak appetite may drive investors toward safer assets.
Look at the technical view
Execute your next move with confidence using a range of advanced technical indicators.
Final thoughts
Fundamental and technical analysis approach the forex market from different angles, but both play an important role in effective trading. While technical analysis focuses on historical price charts, patterns, and indicators to anticipate future price movements, fundamental analysis looks at the broader economic forces driving currency values. Together, they can form a more balanced approach to understanding broader forex market conditions and adapting to changing market dynamics.
A fundamental analysis in forex typically centers on macroeconomic rather than microeconomic factors, including GDP growth, inflation, unemployment figures, trade policies, and central bank interest rate decisions. These broader economic forces often shape long-term currency strength and market sentiment, which is why understanding the relationship between macroeconomic and microeconomic factors can help traders better evaluate currency movements. While fundamental analysts focus on economic news and policy developments, technical traders rely on price action and chart signals to identify shorter-term opportunities.
Neither method is inherently better than the other, as each suits different trading styles and time horizons. Technical analysis is often favored by short-term traders looking to react quickly to price movements, while fundamental analysis tends to support longer-term strategies built around economic trends. In practice, many traders combine both approaches, using fundamental analysis to understand market direction and technical analysis to refine entry and exit points, creating a more complete view of the forex market.
Frequently asked questions
What economic indicators matter most in fundamental analysis for forex trading?
Some of the most important economic indicators include interest rates, GDP, inflation, employment data such as Nonfarm Payrolls, and central bank decisions. These data points can influence exchange rates, shape market expectations, and help support a fundamental trading approach.
How does fundamental analysis respond to major economic shifts?
Fundamental analysis can help traders interpret how major economic shifts, including natural disasters, trade disruptions, or policy changes, may affect currency values. By assessing such information alongside broader economic indicators, traders can adjust their trading strategy to changing market conditions.
Can fundamental analysis and technical analysis be used together?
Yes, many traders combine both methods. Technical analysis focuses on price action, while fundamental analysis looks at the external drivers behind those movements. Using both can help traders build a more balanced trading strategy for short- and long-term opportunities.
Share:
Related


Exness Trade app
Trade with confidence anytime, anywhere.


Get the app
App title

Trading is risky. T&Cs apply.


