Commodities technical analysis: Tips and techniques for CFD traders

Looking to sharpen your commodities trading skills and predict market moves with confidence? Discover how commodities technical analysis can help you master price charts, spot patterns, and make smarter decisions through data-driven commodity analysis.
Worried that your trades might be influenced by emotion or confirmation bias? Support your decisions with a commodity market analysis. This technical approach takes the emotion out of your trading strategy and focuses on facts, including historical price and volume data.
Used by all types of traders, a commodity trading analysis can be adapted to suit any timeframe and commodity, and with this guide, even inexperienced traders will discover how to correctly perform and understand a technical analysis.
Content
- What is technical analysis in commodity trading?
- Key chart types used in commodity technical analysis
- Essential indicators for commodities technical analysis
- Pattern recognition and trading signals
- Timeframes and technical setups for CFD traders
- Risk management in technical analysis for commodities
- Integrating technical and fundamental analysis
- Tools and platforms for commodities technical analysis
- Key takeaways
- Final thoughts
What is technical analysis in commodity trading?
A commodities technical analysis uses statistical analysis to identify optimum trading positions, accounting for aspects such as historical prices and volume.
Why technical analysis is crucial for CFD traders
CFD traders can use a commodity market analysis to judge optimal entry and exit points based on factual information such as previous prices and volume. It takes emotion and speculation out of the equation. Rather than acting on hunches based on current trends or emotions driven by the desire that the price will climb, they’re basing their decisions purely on the data.
There are no guarantees, and a market analysis is not an exact science, but it can give traders an advantage when predicting how the market will move.
Commodity analysis can be conducted on all types of commodities, including soft commodities like wheat and soy, and hard commodities like gold and silver. Similar strategies are used to speculate on the price of currencies and indices.
How technical analysis differs from fundamental analysis
Although a fundamental analysis serves the same purpose as a technical analysis, it requires a different approach.
While a technical analysis focuses on price and volume, a fundamental analysis focuses on underlying factors that may influence the price. In commodities, this includes everything from the level of production and consumption to current inventories. It also attempts to account for geopolitical events that may create negative/positive market conditions, such as political instability and tariffs.

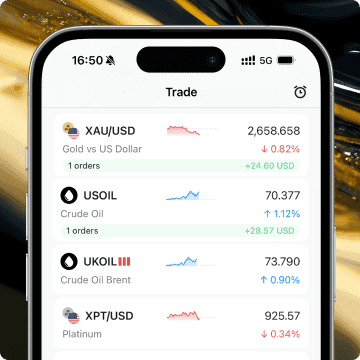
Exness Trade app
Trade with confidence anytime, anywhere.
Key chart types used in commodity technical analysis
Charts offer a visual representation and make it easier to spot patterns. Some of the most common charts used in a commodity trading analysis include line charts, bar charts, and candlestick charts.
These charts encapsulate a designated trading period and simplify the analysis process.
Line charts
Line charts are simplified charts that plot the price of an asset using a line. They typically focus on closing prices, ignoring opens, highs, and lows to provide a straightforward visualization.
Bar charts
Bar charts, also known as OHLC (open-high-low-close) charts, are visually represented as a simple vertical line, with every bar denoting a specified time period. They provide traders with quick insights into price movements.
Candlestick charts
Candlestick charts were first developed for use in the commodities markets, focusing on rice in particular. They are now used for various trading instruments but remain an essential part of any technical analysis.
Each candlestick shows four pieces of information:
- The open—the top of the candle on a “down” day and the bottom on an “up” day.
- The close—the top of the candle on an “up” day and the bottom on a “down” day.
- The high price—the upper wick.
- The low price—the lower wick.

Choosing the right chart for CFD trading strategies
The best chart will depend on the information and time period being analysed, as well as trader preference.
Line charts are beginner-friendly, but they don’t present the depth of information found in bar charts or candlestick charts. If you need to plot multiple statistics over a longer period, these latter two options may be more suitable.
Essential indicators for commodities technical analysis
Indicators are technical patterns created by factors such as price, volume, momentum, and open interest, and traders may use various indicators during a commodities technical analysis.
Moving Averages
Moving Averages (MA) level out price data over a specified timeframe. They create a regularly updated average price to measure price trends, which can be expressed as Simple Moving Averages (SMA) or Exponential Moving Averages (EMA):
- Simple Moving Averages: Common among technical analysts, the SMA divides the sum of a given number of prices by the total available prices. It’s a simplified indicator that gives equal weight to each value.
- Exponential Moving Averages: The EMA places a greater emphasis on recent prices than the SMA, showing a pattern more indicative of recent trends.
Relative Strength Index (RSI)
The RSI calculates closing prices in a specific period to determine overbought and oversold conditions. It uses a scale of 0 to 100, with 70+ being oversold and 30 or less being overbought.
For more information on how to trade with the RSI indicator, read Mastering the RSI indicator: How to use it for trading success.
MACD (Moving Average Convergence Divergence)
A momentum oscillator for trading trends, the MACD measures the relationship between two moving averages to highlight price trends and momentum.
Bollinger Bands
Bollinger Bands help investors determine if certain commodities are under- or overvalued. They appear as three lines showing the moving average along with upper and lower prices, representing overbought and oversold conditions.

Fibonacci retracements and extensions
Traders use Fibonacci retracements to find support and resistance levels. This indicator is based on the Fibonacci sequence and so-called Fibonacci ratios, such as 38.2% and 61.8%. The idea is that a trending market will retrace/return to a previous price before resuming its trend.
For instance, if an asset is worth 100 USD and rises to 150 USD, traders will calculate the difference between the high and low, 50 USD in this case, and then multiply it by a Fibonacci ratio to find a potential support or resistance level. If they use 61.8%, for instance, it comes to 130.90 USD, which is the point where traders will consider opening a trade.
Fibonacci extensions extend the ratios beyond 100%, such as 161.8%.
Pattern recognition and trading signals
Pattern recognition is a key skill that can give traders an edge when trading commodities. Traders can use various patterns, including head-and-shoulders, tops and bottoms, triangles, and flags, to analyse the market. The best option will ultimately depend on the trader’s preferences and approach.
Similarly, trading signals are indicators that traders use to find the most optimal moments to enter/exit a position.
Support and resistance levels
Support and resistance levels are fundamental concepts of commodity technical analysis. The support level indicates where an asset will gain support and rise, while the resistance level indicates where buyers will back away. The former halts a downtrend while the latter pauses an uptrend.
Support occurs because an asset becomes more attractive the cheaper it gets, with buyers entering the market during a downtrend and sending the price the other way. Inversely, resistance indicates that demand has outstripped supply, suggesting that a sell-off will occur.
Support and resistance levels can be tracked during all time periods, from one-minute charts through to monthly charts.
Common chart patterns
Chart patterns help traders visualize price movements and find support/resistance levels:
- Head and shoulders: Often seen in a commodities technical analysis, this pattern shows a trend reversal from bullish to bearish. It consists of a left and right shoulder with a head in the middle and a neckline drawn across the bottom. The pattern is “confirmed” as a bearish reversal when the price breaks below this neckline.
- Triangles: An ascending triangle is a bullish formation with a horizontal line across similar highs and an upward diagonal line showing higher lows. A descending triangle is the opposite, with a horizontal lower line depicting similar lows and a downward diagonal line depicting lower highs. It is typically considered bearish.
- Flags: Flags are parallel trend lines that converge at the high and low points of the commodity’s price to create a flag-like pattern. They can indicate an upcoming breakout by signalling a continuation of a previous trend.
Trend lines and breakout signals
A trend line marks a pattern by connecting price highs or lows—the more connections the line makes, the stronger it is. A breakout signal occurs when a price moves past a resistance or support level, signaling a market shift.
Diversify with commodities
Explore metals and energies with low, stable spreads.
Timeframes and technical setups for CFD traders
The timeframe is key to conducting a commodity analysis. A price can appear bullish on a five-minute chart and bearish on a daily chart. A proper commodity technical analysis, therefore, must consider the timeframe and technical setup.
Scalping vs swing vs position trading
Your trading preference will determine your chart setup:
- Scalping holds trades for a few minutes or seconds.
- Swing trading holds onto trades for a few days.
- Position trading keeps those trades active for days, months, or even years.
Intraday vs long-term charts for commodities
Intraday trading involves buying and selling commodities in a single day. It’s a highly volatile option that may not be suitable for novice traders still familiarizing themselves with trading platforms and charts. It can offer higher returns but requires rapid decision-making.
Long-term charts measure the price of a commodity over a protracted period. It’s a slower-paced and more measured approach to trading—perfect for beginners and those seeking a more stable approach.

How to choose timeframes based on your CFD trading goals
If you’re seeking short-term gains and want to profit from small market movements, consider intraday trading. Bear in mind that intraday traders are often glued to their screens and primed to react to any market movements. If you’re a casual trader dipping in and out for several minutes at a time, or you’re worried about short-term volatility, consider longer timeframes.
Risk management in technical analysis for commodities
Always consider risk management strategies during a commodities technical analysis. They won’t prevent losses, but they can help to stabilize your trading and guard against sizable capital losses.
Stop loss and take profit placement
A stop loss ends a trade when the price drops below a certain point; a take profit ends when it climbs to a predefined level.
For instance, if you open at 100 USD, you could set a take profit at 150 USD and a stop loss at 50 USD. That way, you won’t lose more than 50 USD and will automatically take a 50 USD profit if the price hits that mark.

Using technical indicators to manage risk
Technical indicators highlight potential support and resistance levels, indicating when a trend may continue and a breakout will occur. When used in combination with stop loss and take profit, they allow traders to properly define their goals and protect their capital.
Avoiding overtrading and confirmation bias
Trade using analytics and not emotion. Taking losses to heart could lead to impulsive buying and selling, known as overtrading. Confirmation bias is just as dangerous and occurs when traders seek information that confirms their beliefs rather than information that supports a trend.
As an example, a trader may speculate that the price of gold will rise. Rather than checking trends and conducting an unbiased commodities technical analysis, they look for indicators that support that fact, inevitably leading them to a trade they were always going to make.
Integrating technical and fundamental analysis
Technical analysis and fundamental analysis each have their place, but it’s also possible to combine the two.
Combining price charts with market news
Combine technical price charts with market news that impact commodities to determine if one supports the other. For instance, price charts may signal an uptrend in the price of silver, with worrying geopolitical events supporting such a trend.
When to prioritize technicals over fundamentals
Although technical and fundamental analyses can be used for all timeframes, the technical approach is usually better suited to short-term trading strategies like scalping, while a fundamental analysis is more effective at predicting long-term price movements.
Tools and platforms for commodities technical analysis
The right techniques, in combination with analytical tools, can support traders with their commodities technical analysis.
Best charting software for CFD traders
Exness users can use various charting tools across the following platforms:
- Exness Terminal: A fast and intuitive platform designed to make life easier for beginners while providing active traders with a range of features and tools. It’s a web-based terminal that supports most desktop and mobile platforms.
- MetaTrader 4: Typically seen as a forex-focused platform, MT4 can be used to trade hundreds of instruments. It offers nine timeframe options, various charts and tools, and a user-friendly setup.
- MetaTrader 5: Trade over 200 instruments with support from various analytical tools, 38 indicators, and eight pending order types.

Recommended brokers with strong analytical tools
Exness offers some of the most robust analytical tools. Whether you’re scalping or looking at the long-term, you can use various charts, patterns, and indicators to perform a commodity analysis. It’s a user-friendly platform with straightforward navigation that provides easy access for beginners while offering experienced traders a more in-depth analytical approach.
Exness Trade app
Trade with confidence anytime, anywhere.
Key takeaways
- Commodities technical analysis removes emotion from trading. By focusing on factual price and volume data, traders can make more objective market decisions and avoid emotional bias.
- Commodity technical analysis differs from fundamental analysis. While technical analysis studies price and volume, fundamental analysis assesses production, consumption, and geopolitical influences.
- Past price patterns can reveal future market trends. Recognizing formations like head and shoulders or triangles helps traders anticipate potential price movements.
- Choose the right chart for your strategy. Line, bar, and candlestick charts each provide unique insights that can increase trading accuracy.
- Indicators help verify potential trades. Tools like RSI, MACD, and Bollinger Bands assist in confirming trend strength before entering a position.
- Support and resistance levels guide entry and exit points. Once formed, these levels can signal when a trend is likely to reverse or continue.
- Timeframes impact the outcome of a commodity analysis. A short-term chart may suggest a bullish outlook, while a longer-term view could indicate bearish conditions.
- Risk management is crucial in commodities technical analysis. Stop loss and take profit orders help verify trading strategies and protect against large losses.
- Integrating technical and fundamental methods strengthens accuracy. Combining chart patterns with commodity market analysis news offers a more complete view of price drivers.
- The right platform enhances commodity trading analysis. Tools from brokers like Exness make it easier to perform advanced commodity analysis with precision.
Final thoughts
A commodities technical analysis uses factual data such as historical prices and volume to speculate on future prices. Traders use various charts, patterns, indicators, and signals to plot trend lines, find resistance and support levels, and predict breakouts, before managing risk with stop loss and take profit orders.
The key advantage of a commodities technical analysis is that it takes emotion out of the equation and focuses on facts. But it can also be a lengthy and complicated process, especially for beginners. If you’re new to trading and want to predict future price swings more accurately, then sign up for an Exness demo account and test your analytical skills with virtual money before switching to the real thing.
Share:
Related


Exness Trade app
Trade with confidence anytime, anywhere.


Get the app
App title

Trading is risky. T&Cs apply.


