
Combining the Williams Percentage Range (%R) with other indicators


The Williams Percentage Range (%R) is a powerful momentum indicator, but it works best when combined with other tools. In this guide, you’ll learn how to use the Williams Percentage Range with indicators like RSI, MACD, and moving averages to improve timing, confirm trends, and trade with greater confidence.
Invented by commodities trader Larry Williams in 1973, the Williams Percentage Range has become one of the most popular indicators in trading. Combining it with other indicators, however, is where you can glean the most valuable insights.
One indicator is a hint; several indicators together are confirmation.
That’s the principle I live by when navigating the trading world, and it makes even more sense when working with the Williams Percentage Range (%R).
For those who don’t know, this is a momentum oscillator that almost always has to be paired with other indicators—whether that’s RSI, MA, or EMA. Understanding the role of momentum indicators, including how the Williams Percentage Range compares with tools like MACD and the stochastic oscillator, helps build a more complete technical analysis strategy.
Hardly any traders use the Williams %R in isolation, so if you’re thinking of adding it to your trading toolkit—and being successful at the same time—you shouldn’t either.
So why is confluence so important in this case, and how can combining indicators improve your edge? Before we get into that, let’s first look at Williams %R and how it works.
Content
- What is the Williams %R and how does it work?
- The most popular indicators to combine with the Williams %R
- How I use the Williams %R with other indicators in practice
- Best Williams Percentage Range (%R) combinations for different trading styles
- Williams Percentage Range strategy example: EURUSD trade
- Tips for combining Williams Percentage Range with other indicators
- Is a Williams Percentage Strategy right for you?
- Final thoughts on mastering Williams %R combinations
- Frequently asked questions
Key takeaways
- Williams Percentage Range (%R) is a momentum indicator that measures price extremes. The Williams %R indicator compares the most recent closing price to the highest high and lowest low over a specific period to identify overbought and oversold conditions in the market.
- Overbought and oversold readings are signals, not standalone trade triggers. While Williams %R values in the overbought zone or oversold levels can help identify potential reversals, relying on these readings alone often yields false signals without confirmation from other technical indicators.
- Combining the Williams %R with other technical analysis tools improves accuracy. Pairing the Williams Percentage Range indicator with tools like RSI, MACD, moving averages, or the stochastic oscillator helps confirm weakening momentum, trend direction, and higher-probability entry and exit points.
- The Williams %R works best when aligned with the current trend. Using the indicator in the context of the broader market trend allows traders to avoid counter-trend setups and focus on overbought or oversold conditions that occur within strong uptrends or downtrends.
- Effective use of the Williams %R depends on the timeframe, market, and risk tolerance. Forex traders and other market participants should adjust the look-back period and combine Williams %R with complementary momentum oscillators to match their trading style, underlying security, and risk tolerance.
Make smarter trading decisions
Use expert analysis and tools on demo accounts or a live account.
What is the Williams %R and how does it work?
Williams %R is a momentum-based oscillator used in technical analysis, primarily to identify overbought and oversold conditions.
It moves on a scale of 0 to -100, with readings closer to 0 suggesting the price is trading near its recent highs (overbought), while readings closer to -100 indicate the price is near its recent lows (oversold).
As for how it’s calculated, it compares the most recent closing price to the highest high and lowest low over a user-defined number of periods.
Anything above -20 often signals that the price is stretched to the upside, whereas anything below -80 signals that it’s stretched to the downside. Anything between -20 and -80 signals neutral territory, where price is consolidating or moving without any notable pressure.

The most popular indicators to combine with the Williams %R
Those are the basics, and if you’ve been in the trading-verse for any amount of time, you’ll recognise how useful an indicator like this can be for spotting potential turning points in the market.
But turning points alone aren’t going to determine how successful your trades will be. On the contrary, if you listened to %R alone, you could easily jump into a trade too early or entirely misread it in the context of the market.
Let’s look at the screenshot I just used. If you only had %R as an indicator, you might look at the indicator being in the -20 zone and decide to sell immediately, assuming a reversal is imminent. But without checking for other signals, there’s every chance that the move could backfire.
If you want to make the most out of the Williams Percentage Range, you’re going to have to pair it with other indicators that not only confirm those turning points but also confirm trend direction, filter out noise, and strengthen the consistency and accuracy of your trades.
Relative Strength Index (RSI)
RSI is one of them. Yes, both the Williams Percentage Range and RSI are momentum oscillators, but RSI tends to be much smoother, which helps filter out some of the noise that %R can produce in fast-moving markets. Let’s look at another example to demonstrate this:

Moving Average Convergence Divergence (MACD)
MACD is another useful indicator to have alongside the Williams Percentage Range. It’s a trend-following indicator that works particularly well when combined with %R reversals, helping you confirm whether a potential turning point aligns with the broader market trend.

Moving Averages (MA & EMA)
Moving averages like MA and EMA can be useful for trend analysis, as they both smooth price action and highlight the market's overall direction. By layering them underneath the %R signals, you have a far better chance of avoiding counter-trend entries and focusing on trades that align with the prevailing momentum.

Bollinger Bands
Another indicator that can support Williams %R is Bollinger Bands, which help to visualise volatility and potential overextended price moves. By pairing the two, you can highlight false breakouts and gain a clearer sense of when the price is stretched beyond its normal range.

Stochastic Oscillator
Lastly, the Stochastic Oscillator can be a good indicator for confirming overbought and oversold conditions. Like RSI, it’s similar to Williams Percentage Range in that it measures momentum and identifies potential reversal zones, but it’s not identical to it. While the %R reacts very quickly to recent price extremes, the Stochastic Oscillator is slightly smoother and often uses both the %K (raw momentum) and %D (signal line) lines to provide additional confirmation.

Indicator | What it Shows | Why Combine with %R? |
RSI | Measures momentum | Smooths out noise and confirms %R extremes. |
MACD | Trend-following momentum indicator | Confirms whether a %R reversal aligns with the broader trend. |
MA | Average price over a set period. | Provides trend context. |
EMA | Weighted moving average | Similar to MA, but more sensitive. |
Bollinger Bands | Shows volatility and price relative to the recent trading range. | Highlights overextended moves, helping to identify false breakouts. |
Stochastic Oscillator | Momentum oscillator | Confirms %R signals while filtering false ones. |
How I use the Williams %R with other indicators in practice
The indicators I mentioned are the ones I use with %R. But what exactly do I use them for? The applications range from confirming overbought and oversold signals to spotting early reversals and filtering breakout signals. But there are numerous other ways you can combine %R with other tools to improve timing and align your trades with the broader trend.
Confirming overbought and oversold signals
One of the simplest ways I use the %R is to confirm overbought or oversold signals. For instance, if the %R enters the oversold zone and RSI is also below 30, this alignment gives me higher conviction that a potential bullish reversal may be coming.
Spotting early reversals
Williams Percent Range can also help spot early reversals when used alongside trend-following indicators like MACD. For example, a classic divergence setup is one where the price makes a higher high but the %R fails to reach a new extreme,or when the MACD shows weakening momentum and starts to flatten or cross down while the price is still climbing. This combination signals that the current uptrend might be losing strength, increasing the likelihood of a pullback or trend reversal.
Filtering breakout signals
Breakouts often lure traders in, but many fail because the price is overextended. I’ve found that combining Bollinger Bands with Williams Percentage Range helps to avoid these traps. For instance, if the price breaks above the upper Bollinger Band but the %R is already in the overbought zone, it signals that the breakout is stretched and a pullback is likely.
Best Williams Percentage Range (%R) combinations for different trading styles
I said before that there are numerous ways to combine the Williams Percentage Range with other indicators. But the way you choose to do it will depend entirely on your specific trading style and timeframes.
Day trading with Williams Percentage Range and Bollinger Bands
For intraday setups, you could combine the%R with indicators often used in day trading, such as Bollinger Bands, that help confirm momentum extremes. On shorter timeframes, the %R can quickly signal overbought or oversold conditions, but by using Bollinger Bands, you can see if the price is truly stretched relative to its recent range, or just making minor fluctuations within normal volatility.
Swing trading with Williams Percentage Ranges and MACD
For longer timeframes, such as weekly charts, you could combine the Williams Percentage Range with MACD and then look for divergences where the price and the %R are confirmed by MACD momentum signals. For instance, if the price makes a higher high but the %R shows a lower high and MACD is weakening, it could signal a swing trade opportunity in the opposite direction.
Scalping with Williams Percentage Range and EMA
For quick scalping trades, you could also pair the %R with short-term EMAs, aligning your entries with the prevailing trend. While the %R identifies overbought or oversold conditions, EMA confirms whether the trend is upward or downward, giving you far more confidence and precision in timing your entries and exits.
Williams Percentage Range strategy example: EURUSD trade
Speaking of entries and exits, let’s take a look at an example of that in action. For this walkthrough, I’m using a 1-hour EURUSD chart, combining the %R with MACD—but as I mentioned, the indicator you use will depend on your trading preference.
- Setup: Price near resistance, the %R is overbought, and the MACD crossing is down
The first thing I’m going to do is identify a potential reversal area where the price is approaching a known resistance level. This means looking for the %R to be in the overbought zone, while the MACD shows the blue line crossing below the orange signal line.
- Entry: Short position
Once these conditions are met, I’m going to enter a short position, anticipating a pullback or reversal from the resistance zone.

- Exit: The %R crosses back above -80 or MACD flattens
I’ll then plan my exit by watching for the %R to return to neutral or oversold territory, or for the MACD to flatten, signalling that momentum has slowed and it might be time to close the trade.

Tips for combining Williams Percentage Range with other indicators
That’s just a brief example of the %R in action, but if you want to trade effectively, there are a few key things you’ll need to remember. Here are my five top tips:
- Always pair momentum with trend/context.
- Don’t overload, use 2-3 indicators max.
- Adjust settings to your timeframe.
- Look for confluence, not contradictions.
- Test combinations in a demo account before going live.
Is a Williams Percentage Strategy right for you?
Whether or not a Williams Percentage Strategy is right for you depends on what you’re looking to use it for. If you already like oscillators and just want a bit more confirmation, it’s certainly a good choice.
It’s strong for range trading, adaptable for trends with MA and MACD, and useful for spotting early reversals and filtering false breakouts. But again, it all comes down to your trading style, risk tolerance, and how comfortable you are with combining multiple indicators rather than relying on a single one.
Trading glossary
Williams Percentage Range (%R) The Williams Percentage Range or %R, also known as the Williams R indicator, is a momentum indicator developed by Larry Williams that measures the most recent closing price relative to the highest high and lowest low over a specific look-back period to identify overbought and oversold conditions.
Overbought and oversold levels Overbought and oversold levels refer to predefined thresholds in momentum oscillators, where an overbought reading suggests price may be stretched near the highest price in its recent range, while an oversold reading indicates price is near the lowest price and may be considered oversold.
Momentum oscillator A momentum oscillator is a type of technical analysis tool that tracks price movements and momentum by comparing the closing price to a high-low range over a set time period, helping traders detect weakening momentum, momentum failures, and potential entry and exit points.
Look-back period The look-back period is the specific period used in indicators like the Williams Percentage Range to calculate raw values based on the highest and lowest prices, directly affecting how quickly the indicator moves and how sensitive it is to new price data.
Indicator confluence Indicator confluence occurs when multiple technical indicators—such as the Williams Percentage Range, moving averages, MACD, or stochastic oscillator—produce aligned signals, helping forex traders reduce false signals and confirm overbought or oversold conditions within the current trend.
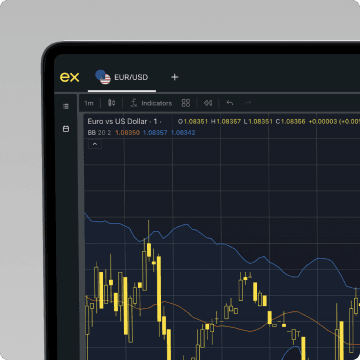
Look at the technical view
Execute your next move with confidence using a range of advanced technical indicators.
Final thoughts on mastering Williams %R combinations
There’s no doubt about it: if you use Williams %R alone, you’re only setting yourself up for false signals. Using it in combination with other indicators, however, and you’re on the road to clarity.
Just remember, practice and test these combinations in a demo account first, making sure you know exactly what you’re doing before you apply your strategy to the real world.
Frequently asked questions
What are the overbought and oversold levels in the Williams Percentage Range?
In the Williams Percentage Range indicator, values above -20 indicate overbought conditions, while values below -80 signal oversold levels, helping traders identify potential reversal zones within a recent price range.
Is the Williams %R a leading or lagging technical indicator?
Williams %R is considered a leading momentum oscillator because it reacts quickly to price movements, but this sensitivity can also lead to false signals if it’s not confirmed with other technical analysis tools.
Can Williams %R be used on any market or currency pair?
Yes, the Williams %R indicator can be applied across forex currency pairs, stocks, indices, and commodities, making it versatile for traders analyzing different markets and underlying securities.
Should the Williams Percentage Range be used alone or with other indicators?
Most traders combine the Williams Percent Range indicator with other technical indicators, such as RSI, MACD, moving averages, or the stochastic oscillator, to confirm signals and refine entry and exit points.
What is the best timeframe for using the Williams %R?
There is no single best timeframe—Williams %R can be used for any time period, but the look-back period should be adjusted based on trading style, market conditions, and individual risk tolerance.
Does an overbought reading always mean the price will reverse?
No, an overbought reading does not guarantee a reversal, especially during a strong uptrend where price can remain in the overbought zone for an extended period.
How is the Williams %R different from the Stochastic Oscillator?
The main difference is that Williams %R uses a reversed scale and reacts faster to new price data, while the stochastic oscillator is smoother and often better at filtering noise in volatile markets.
Share:
Related
Trading Pro Q&A: How do you validate support and resistance levels?
Trading Pro Q&A

Balancing fundamentals and technical analysis for forex
Expert opinions

Trading Pro Q&A: What market structure concepts do you rely on most, and why?
Trading Pro Q&A

Bitcoin technical analysis: Reading crypto's unique trends
Analysis

Exness Trade app
Trade with confidence anytime, anywhere.


Get the app
App title

Trading is risky. T&Cs apply.


