Standard Deviation indicator: How to measure volatility in trading

How do traders calculate standard deviation to spot when the market is calm versus highly volatile? The Standard Deviation indicator makes it simple, translating deviation in forex and other markets into clear insights you can use to sharpen your strategy.
Volatility in trading is a double-edged sword. Sure, it creates opportunities for profit when prices move strongly in your favour, but sharp swings mean bigger risks, especially if you’re not ready.
That’s why the number one lesson in trading is how to sense when the tide is turning, figuring out how extreme the price movements will be, and how you should react.
Luckily, it’s not about following your gut or the stars. This is why the Standard Deviation indicator has become such a popular tool in recent years.
This trading volatility indicator is designed to capture the degree of variation in price movements. It translates volatility into a simple number that traders—and you—can apply directly to a strategy. Think of it like an anchor against a sudden tide.
Content
What is the Standard Deviation indicator and how does it work?
The Standard Deviation indicator is almost like a temperature gauge, literally. While the price movements on a chart will tell you where the market is going, the Standard Deviation will show you how “hot” or “cold” the market is in terms of volatility.
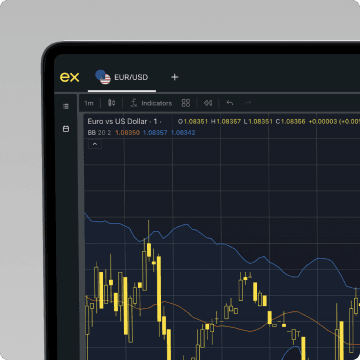
Take a look at this chart below showing the gold vs the US dollar price:

You can see the Standard Deviation rising and falling in response to price movements. When the price swings strongly, the indicator spikes. This indicates increased volatility. When the price stabilises, the indicator drops. There’s your calmer market.
Notice how the green number on the right updates in real time, demonstrating the current measure of volatility at any moment? Approaching 10:15, it was sitting at 0.12, indicating that the market was experiencing low volatility, not completely calm, but far from the extreme swings seen earlier. This is a good time for any pro-trader to brew a coffee or walk the dog.
Essentially, the Standard Deviation indicator is designed to help traders quickly assess market conditions and make more informed decisions.
Look at the technical view
Execute your next move with confidence using a range of advanced technical indicators.
How to calculate Standard Deviation in trading
Standard Deviation is probably something you vaguely remember from those maths lessons in which people were saying, “How is this going to help me in life?” So, class, let’s do a quick recap on the calculation.
The process is based on measuring how much individual price points deviate from their average over a chosen period. In other words, it tells you how “spread out” the prices are around the mean. The higher the standard deviation, the more volatile the market; the lower it is, the calmer the market.
Here’s the formula:
The formula explained simply
The Standard Deviation formula is:
{∑ (P − Average)²/ n} 1/2
It may look complicated, but it’s actually helpful.
You take each price (P), subtract the average (Average), square the result, divide by the number of data points (n) to find the average, and then take the square root. What this leaves you with is a single number that quantifies the market’s volatility over the selected period.
Step-by-step example With prices
Let’s walk through an example. You want to calculate the Standard Deviation for a 7-day period using closing prices. Over seven days, the closing prices are 100, 102, 101, 103, 104, 106, and 105, resulting in an average of 103. From here, you would calculate the deviation of each price from the average, then square each deviation to remove negative values.
After that, you’d sum all the squared deviations, divide by the number of periods—in this case, seven—to get the average squared deviation, and then take the square root of that result. This would give you one solid, whole number that covers those seven days.
For those who are visual learners, here’s a table that lays it out more clearly:
Day | Closing price | Deviation from average | Squared deviation |
1 | 100 | -3 | 9 |
2 | 102 | -1 | 1 |
3 | 101 | -2 | 4 |
4 | 103 | 0 | 0 |
5 | 104 | 1 | 1 |
6 | 106 | 3 | 9 |
7 | 105 | 2 | 4 |
Don’t be scared to employ the formula. Using it, you can calculate that the Standard Deviation is two. Which means what in “spread”? The prices typically vary by two units from the average over this 7-day period.
Why use the Standard Deviation indicator?
Volatility underpins the entire need for Standard Deviation. It's been a buzzword in the trading market ever since crypto hit the mainstream, but that doesn’t make it something to overlook or dismiss, like a pop album. Volatility is a key factor in managing risk and spotting trading opportunities. There’s no way around it. What Standard Deviation in trading essentially gives you is a quantitative measure of how much prices are moving, rather than just relying on visual impressions of the chart.
Let’s break down that formula a little bit more so we get into the granular details:
Squaring the differences highlights big moves
Squaring each deviation ensures that large swings are given more weight than small fluctuations. The indicator only makes a fuss when facing big changes. It’s what traders want to see, what the alarm bells should be sounding for: activity.
Taking the average keeps things balanced
By averaging the squared deviations over your chosen period, the indicator smooths out short-term spikes and dips. Steadying the ship like that smooths out the smaller blips, readying the indicator for those larger swings you’re eager for.
The square root matches the price scale
Taking the square root at the end converts the measurement back into the same units as the price itself. Everything becomes directly proportional and comparable. It provides a practical gauge of how far prices are deviating from their average.
When you boil it down, it’s all about making better, informed trading decisions. The Standard Deviation Indicator brings trading back into the “science” camp, rather than the “art” one, but you still need to care for and nurture your intuition, as it remains an important part of the decision-making process. Your gut can talk with your head as it sees clear, numerical evidence of market conditions, which is invaluable for both short-term and long-term trading strategies.
How to use the Standard Deviation indicator in practice
Let me not sugarcoat it: Using the Standard Deviation indicator values effectively takes practice. As a common trading volatility indicator, it’s built into most trading platforms, so use it. The Standard Deviation indicator can be added to a chart with just a couple of clicks, but once it’s active, you need to know how to effectively interpret the numbers and integrate them into your trading strategy.
Setting up the indicator on your chart
Let’s start by setting up the indicator and selecting the period length that best suits your trading style. In this case, we’ll use the USDZAR forex pair, which is one of the most popular right now for retail traders in South Africa.


Once the indicator is set up, you can start observing how volatility changes in real-time, utilizing a few strategies to time entries and exits, and confirm potential breakouts or trend reversals.
Strategy examples you can try
One of the most common strategies is the volatile breakout strategy, which involves identifying periods of low volatility followed by a sudden increase in volatility. If you see the Standard Deviation indicator spike after a period of calm, that signals that the market could be about to make a strong move, which subsequently signals an opportunity to enter the trade in the direction of the breakout.
Here’s an example:

Sometimes, of course, a spike in volatility happens at the end of a trend, not the start. Again, Standard Deviation can help traders spot this when the price moves sharply and then suddenly stalls. Like with all data, you have to be able to interpret and understand the context in which it’s produced.
A common strategy you could employ here is the high volatility reversal strategy, where traders watch for a surge during a significant price move, wait for the price to pause or reverse, then trade in the opposite direction with tight risk control.
Range trading during periods of low volatility is also something you could look into. When the line is flat for a while, you’d expect sideways movement, using oscillators like RSI to fade the extremes while Standard Deviation stays low. This means you can enter buy positions near support and sell positions near resistance, capitalising on the predictable swings within the range.
For more guidance on combining volatility tools with trend indicators, see our article on top forex indicators.
How does it compare to other volatility tools?
Those are just a few strategies that demonstrate the effectiveness of the Standard Deviation indicator, but there are other volatility tools that you can use. For example:
Indicator | What it measures | Typical use | Strengths |
Chaikin Volatility | Rate of change of the trading range over time. | To detect volatility expansions or contractions. | Highlights increasing or decreasing volatility trends early. |
ATR | Size of recent price movements. | Setting stop loss levels and position sizing. | Helps with risk management. |
Bollinger Bands | Standard deviation combined with a moving average. | To identify overbought or oversold conditions, as well as potential breakouts. | Combines volatility with price levels. |
To see how the standard deviation indicator stacks up against other metrics, check out our guide to the top 20 trading indicators.
Limitations of the Standard Deviation indicator
Both ATR and Bollinger Bands, specifically, can be useful for traders looking to implement more precise risk management, but the Standard Deviation indicator is one of the best for providing a clear, numerical measure of overall volatility. You should never lose sight of the bigger picture when making short-term efforts.
That’s not to say it can’t be vague. Using it in tandem with a complementary strategy—think cheese and grapes—as the number alone doesn’t indicate direction.
False signals can’t be escaped. This is the point at which the “science” part of trading reveals its greyer areas. No technical tool can be 100% correct. Fake signals can be generated, rearing their ugly or beautiful heads (depending on which direction you want the swing to be) during certain market conditions, such as choppy or sideways markets, where volatile spikes might just be random, indicating absolutely nothing worth investing in or selling.
Get those settings and supporting tools correct, though, and Standard Deviation indicator values can be a powerful guide for making those rewarding trading decisions. What you need to do is practice those interpretations, as the data will always only get you so far. Integrate it into a broader analysis framework, rather than relying solely on the raw volatility number.
Make smarter trading decisions
Use expert analysis and tools on demo accounts or a live account.
Key takeaways
- The Standard Deviation indicator is a key concept for measuring market volatility. It functions as a statistical measure that indicates how widely prices fluctuate around their average value, helping traders make more informed decisions.
- Calculating standard deviation involves clear statistical steps. You take the deviation values of each data point from the mean value, square them, average the squared variance values, and finally take the square root to return to the same unit as the price.
- A high standard deviation indicates greater variability and higher risk. When indicator values rise sharply, it signals strong price movements or extreme values, often pointing to potential breakouts or reversals in forex trading and other financial instruments.
- A low standard deviation shows a narrow trading range. This means the market is experiencing low volatility, where prices remain close to the average closing price, often creating opportunities for range trading strategies.
- The standard deviation formula applies across different data sets and trading strategies. Whether you’re analyzing past performance, current prices, or the average return of a currency pair, standard deviation measures give forex traders a consistent way to compare price volatility.
- Risk management and trading strategy benefit from using deviation indicators. By interpreting indicator values in real time, traders can better manage financial risk, identify safer entry points, and avoid being caught off guard by sudden market swings.
- Standard deviation is used alongside other volatility indicators for deeper insight. Tools like Bollinger Bands combine moving averages with deviation values to highlight price trends, identify outliers, and give more weight to extreme values within a normal distribution.

Final thoughts and next steps
Volatility matters, and understanding it matters even more. If you want to trade more confidently and manage risk, the Standard Deviation indicator is one of the most powerful tools to add to your arsenal, whether you’re a day trader, a swing trader, or a long-term investor looking for clear, numerical insight into how prices have been moving.
Getting a feel for it is half the battle. That way, you can recognise how it might change your approach to trading. Using an Exness demo account is the best way to do this, giving you a risk-free space to apply the indicator and observe how it responds to real market conditions.
Once you know how to use it and which trading strategies work best, then you can look at transitioning to a live account, putting your experience with the Standard Deviation indicator to real, practical use.
Share:
Related


Exness Trade app
Trade with confidence anytime, anywhere.


Get the app
App title

Trading is risky. T&Cs apply.


