3 triangle chart patterns and how to use them for trading

What can triangle patterns like ascending, descending, and symmetrical triangles tell us about the market? In this guide, we'll break down each pattern and show you how to spot trading opportunities with confidence.
In technical analysis, patterns have meaning. For traders, knowing how to interpret them can mean the difference between missing a move or riding a breakout to profit. Triangle chart patterns are among the most dependable for forecasting these moves.
Triangles mark a moment of price compression, a period when the market is coiling like a spring and poised to uncoil. It could be an ascending triangle signaling bullish intent, a descending triangle hinting at bearish pressure, or a symmetrical triangle indicating indecision prior to building momentum.
In this guide, we’ll break down the three most important triangle chart patterns. You’ll learn how they work, what makes them different, and how to trade them with confidence.
Content

What are triangle patterns?
In technical analysis, triangle patterns are important chart patterns that form when the market consolidates between converging trend lines. These patterns reflect a temporary pause in the market before the next major price moves take shape. Traders often study triangle formations to better anticipate future price movements and shifts in price trends.
There are three main types of triangle patterns that we focus on: the ascending triangle, the descending triangle, and the symmetrical triangle. Each has its own structure and behavior, but all share the common characteristic of narrowing price action within a triangle-shaped range.
These formations are considered popular chart patterns because they give traders clues about where price moves might happen next, whether a continuation of the current trend or a potential reversal. Understanding these triangle patterns is crucial for anyone looking to trade based on technical chart patterns and market psychology.
In the sections below, we'll break down each triangle type in detail and explain how you can use them to improve your trading strategies.

Ascending triangle: a bullish continuation pattern
What is an ascending triangle?
An ascending triangle pattern is a bullish chart pattern signaling the potential continuation of an uptrend. It usually forms when the price moves within a flat upper resistance line and a rising lower support line, creating a triangle. This suggests that sellers are trying to impose a ceiling at the resistance level. However, the buyers are even more powerful at this stage as they keep pushing the price higher with every bounce. As a result, the converging lines tend to break out upwards beyond the resistance boundary.
Visual characteristics and market psychology:
- Flat top resistance: The horizontal line at the top represents a level where selling pressure has repeatedly halted upward movements.
- Rising support: The ascending line at the bottom shows buyers stepping in at higher prices, reflecting growing bullish sentiment.
- Converging lines: The narrowing space between support and resistance indicates decreasing volatility and a potential breakout point.

How I trade ascending triangles
Trading an ascending triangle successfully comes down to timing the breakout and managing risk carefully. Here’s the approach I follow to enter, protect, and maximize each trade based on this pattern:
Entry points:
I look to enter a trade when the price breaks above the flat top resistance with increased volume. This breakout suggests that buyers have overpowered sellers, and the uptrend will likely continue.
Stop loss placement:
I aim to manage risk by setting the stop loss order slightly beneath the last swing low within the triangle or just below the rising support line. This is an effective strategy to avoid loss from a false breakout and sudden trend reversal.
Profit targets:
I set my profit target by measuring how high the triangle is at its widest point and adding that distance to the breakout level. For example, if the triangle is 5 USD high, I anticipate a 5 USD move above the breakout point.
Risk/reward considerations:
I ensure that the potential reward justifies the risk by aiming for a risk/reward ratio of at least 1:2. This means that for every 1 USD risked, I expect 2 USD in profit, aligning with sound money management principles.
Real example of a successful ascending triangle trade
In a recent trade, I identified an ascending triangle forming over several weeks, with resistance at 100 USD and higher lows indicating rising support. After a decisive breakout above 100 USD, accompanied by a surge in volume, I entered a long position at 101 USD. Placing a stop-loss at 97 USD, below the last higher low, I set a profit target of 110 USD based on the triangle's height. The price reached the target within two weeks, resulting in a profitable trade.
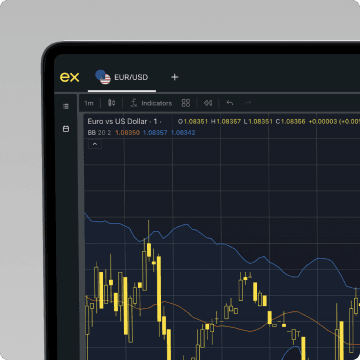
Look at the technical view
Execute your next move with confidence using a range of advanced technical indicators.
Descending triangle: a bearish continuation or breakdown pattern
What is a descending triangle?
This bearish triangle pattern signals the continuation of a downtrend. A triangle sloping downwards is formed by a flat lower support line and a descending upper resistance line. This indicates that buyers are trying to hold the support level while sellers are becoming more aggressive. The converging lines hint at a breakdown below the support level.
Visual characteristics and market psychology:
- Flat support line: The horizontal line at the bottom represents a level where buying interest has consistently prevented further declines.
- Descending resistance line: The downward-sloping line at the top connects a series of lower highs, indicating increasing selling pressure.
- Converging lines: The narrowing space between resistance and support reflects decreasing volatility and a potential breakdown point.

How I trade descending triangles
When trading a descending triangle, precision is key—it’s important to confirm the breakdown and protect against false moves. Here’s the step-by-step strategy I use to trade this bearish pattern effectively:
Entry strategy:
I look to enter a short position when the price breaks below the flat support line with increased volume. This breakdown suggests that buyers have been overwhelmed, and the downtrend will likely continue.
Stop loss placement:
To manage risk, I place a stop loss order just above the descending resistance line or the most recent lower high within the triangle. This approach protects against false breakdowns or sudden reversals.
Profit target logic:
I set my profit target by measuring how high the triangle is at its widest point (the distance between the first high and the support line) and subtracting that distance from the breakout level. For example, if the triangle is 5 USD high, I anticipate a 5 USD move below the breakout point.
Managing false breakdowns:
False breakdowns are possible and can lead to significant losses. To mitigate this, I wait for a decisive close below the support line and closely monitor the volume. A significant increase in volume during the breakdown adds credibility to the move.
Real example of a descending triangle trade
In a recent trade, I identified a descending triangle forming over several weeks, with support at 50 USD and lower highs indicating descending resistance. Following a decisive breakdown below 50 USD, accompanied by a surge in volume, I entered a short position at 49 USD. Placing a stop loss at 52 USD, above the last lower high, I set a profit target of 44 USD based on the triangle's height. The price reached the target within two weeks, resulting in a profitable trade.

Exness Trade app
Trade with confidence anytime, anywhere.
Symmetrical triangle: neutral but powerful
What is a symmetrical triangle?
A symmetrical triangle is a chart pattern that emerges when the cost of an asset creates a range of low highs and high lows, resulting in converging trendlines that meet at an apex. This pattern reflects a period of consolidation and market indecision, as neither buyers nor sellers have a clear upper hand. The symmetrical triangle can break out in either direction—upward or downward—making it a neutral pattern. However, it often serves as a continuation pattern, which means the breakout typically aligns with the prevailing trend preceding the triangle's formation.
Visual characteristics and market psychology:
• Converging trendlines: The upper trendline is downward sloping, cutting higher highs, while the lower trendline is upward sloping, cutting higher lows. This convergence reveals a narrowing price range.
• Fading volume: Patterns are progressing with less action, indicating lower volume and suggesting the asset isn’t moving or being traded, even when there is uncertainty.
• Possible breakout: As the price begins to move closer to the apex of the triangle towards the end, the consolidation period is complete, and breakouts become more likely.

How I trade symmetrical triangles
Because symmetrical triangles can break in either direction, my trading approach focuses on waiting for clear confirmation before making a move. Here’s the method I follow to enter trades confidently and manage risk:
Waiting for breakout confirmation:
Given the neutrality of the symmetrical triangle, I stay patient and wait for a decisive breakout in either direction before initiating a trade. A breakout is confirmed if the price closes beyond one of the trendlines with increased volume, signaling a potential new trend.
Entry and stop loss placement:
- Entry point: I enter the trade immediately after a confirmed breakout. If the breakout is upward, I go long; if it’s downward, I go short.
- Stop loss placement: To manage risk, I place a stop loss order just beyond the opposite trendline or near the most recent swing high or low within the triangle. This strategy protects against false breakouts and unexpected reversals.
Emphasizing volume as a key confirmation tool:
Volume is crucial when validating breakouts. Increasing volume during a breakout adds credibility, indicates strong participation, and reduces the likelihood of a false breakout.
Setting profit targets based on the triangle's height:
To estimate a profit target, I measure the vertical distance between the widest part of the triangle (the initial high and low points) and project that distance from the breakout point. For example, if the triangle's height is 5 USD, I anticipate a 5 USD move in the direction of the breakout.
Symmetrical triangle example trade
In a recent trade, I observed a symmetrical triangle forming over several weeks, with converging trendlines indicating consolidation. Upon reaching a decisive breakout above the upper trendline, accompanied by a surge in volume, I entered a long position at 75 USD. I placed a stop loss at 72 USD, below the lower trendline, and set a profit target at 82 USD based on the triangle's height. The price reached the target within ten days, resulting in a successful trade.

Key takeaways
- Triangle chart patterns in technical analysis: Triangles occur in ascending, descending, and symmetrical formations, which help traders forecast potential price movement based on periods of market consolidation.
- Ascending triangle and bullish trend: An ascending triangle often signals upward momentum, where buyers push prices higher against a flat resistance, leading to breakouts above the upper trendline.
- Descending triangle and downward pressure: A descending triangle shows sellers gaining control, often leading to a breakdown below the lower trendline and continuation of a downward trend.
- Symmetrical triangle chart pattern: This is formed by two trend lines converging. A symmetrical triangle reflects indecision, with breakouts possible in either direction depending on market momentum.
- Symmetrical triangle formation and breakouts: It's critical to wait for breakout confirmation, as the breakout sometimes occurs in the opposite direction of the initial trend.
- Trading chart patterns for price movement: Understanding triangle structures helps traders anticipate major shifts and set smarter entries, exits, and stop loss levels aligned with expected price movement.
- Technical analysis and volume confirmation: Watching volume closely during triangle breakouts improves accuracy, filtering out false signals in technical analysis strategies.
- Descending triangles and bearish setups: Descending triangles often lead to breakdowns, but confirmation through technical indicators helps ensure reliability before taking action.
- Upper trendline and lower trendline battles: The narrowing gap between the upper trendline and lower trendline reflects market compression, often preceding sharp moves when the price breaks out.
- Triangle patterns and risk management: Using triangle patterns with broader technical analysis frameworks helps traders predict breakout directions and manage risk more effectively.
Final thoughts
The ascending, descending, and symmetrical triangle chart patterns provide dependable hints for potential breakouts. As noted earlier, triangles that are ascending are bullish, and triangles that are descending are bearish. Symmetrical triangles are neutral and can break out in either direction. For higher accuracy, wait for confirmation with a spike in volume, always trade in context with the broader trend, and set clear profit targets and stop-loss levels.
Share:
Related


Exness Trade app
Trade with confidence anytime, anywhere.


Get the app
App title

Trading is risky. T&Cs apply.

