
Traders rely on forex market analysis methods such as chart patterns and technical indicators to identify optimal trading opportunities. Learn how to read chart patterns and use analytical tools to improve your forex trading analysis.
Forex is the world’s largest financial market. It’s complicated, dynamic, and impossible to predict with certainty. But with a little understanding, the right trading style, and a combination of chart patterns, price data, and fundamental analysis, you can begin to understand the forex market and make smarter decisions.
In this guide to forex market analysis, we’ll show you how to analyze data, read charts, and find patterns to achieve better results.
Content
Key takeaways
- Forex market analysis combines technical, fundamental, and sentiment approaches. Successful traders use forex chart analysis, economic data, and market sentiment together to make more informed forex trading decisions.
- Forex chart analysis helps identify trends and entry/exit points. By studying price charts, timeframes, technical indicators, and support/resistance levels, traders can better understand market direction and timing.
- Chart patterns and candlestick patterns signal potential price movements. Patterns like ascending triangles, wedges, and hammer candles help traders anticipate breakouts, reversals, and continuation trends.
- Fundamental analysis focuses on economic data and unexpected news events. Interest rates, GDP, inflation, and employment figures can significantly impact currency values, especially when results differ from market expectations.
- Risk management is essential in every forex trading strategy. Even the best forex market analysis should use stop loss and take profit orders to protect capital and manage volatility.
Trade the world's top currencies with Exness
Get tight and stable spreads on every currency trade.
Forex chart analysis: The basics
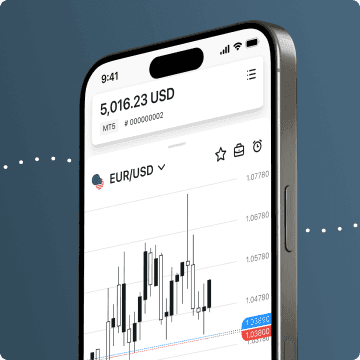
Chart analysis is a form of technical analysis that uses charts and historical price data to identify patterns. It all begins with a simple price chart, which shows current and past price movements for a particular currency pair.
Let’s start with a simple line chart in the Exness Terminal and take things from there.

Using the toolbar at the top left, we can change various parameters to either alter or expand this chart:
- Compare: Click the “+” symbol to overlay other currency symbols, such as GBPJPY, to see if the pound sterling/Japanese yen matches the trajectory of EURUSD.
- Timeframe: The image above shows price movement at 1-minute intervals, a timeframe often used by short-term forex traders, like scalpers. You can adjust this to show movements by minutes (1, 3, 5, 10, 15, or 30), hours (1, 2, and 4), or by day, week, or month.
- Chart types: The line above shows simple price movements. Switch to candlesticks to see all prices (open, close, high, and low) within your chosen time frame; HLC bars for the high, low, and close prices; volume candles to judge market volume, and more.
- Technical indicators: A list of forex market analysis tools that make sense out of price patterns, showing everything from average prices (moving averages and exponential moving averages) to momentum (stochastic oscillator and relative strength index).
These options are not limited to the Exness Terminal. You’ll also find them on platforms like MetaTrader 4 and MetaTrader 5. They should be second nature before you start trading with real money, so sign up for a demo account until you are confident and understand different layouts.
Combining forex market analysis with trading strategies
Once you know what you’re looking at, create trend lines and support/resistance levels to find the general market direction.
- Trend lines: A line drawn by the trader that connects two or more swing lows or highs to indicate market direction.
- Support lines: The point where buying pressure overtakes selling pressure, providing “support” that pushes the price up. Draw these horizontal lines by connecting two or more significant lows.
- Resistance lines: A line indicating where selling pressure overtakes buying pressure and the price drops. Draw a horizontal line connecting two significant swing highs.
Many traders simply follow the trend. If the market is bullish (the trend line is pointing up), they go long. If it’s bearish (the market is trending down), they go short.
This is known as “trend trading”.
Range traders stick within those support and resistance lines—a safe, somewhat predictable range. They buy when the price hits the support line and sell when it reaches the resistance line.
Breakout traders look for moments when price levels break support/resistance lines. These technical traders use indicators like the relative strength index (RSI) to identify overbought and oversold conditions, indicating there is enough momentum to break through those lines and find a new trend.
RSI uses a scale from 0 to 100. Anything over 70 indicates the asset is overbought and could be due for a downturn. Anything under 30 means it’s oversold and may signal an uptrend. In the image below, we see an uptrend hit a score of 74, followed by a predicted downtrend.

Finding trading opportunities using chart patterns
You can find patterns on standard charts and candlestick charts.
Chart patterns are shapes that represent specific price movements, indicate supply and demand factors, and hint at future trends.
Examples of chart patterns:
- Ascending triangle: A rising trend line at the bottom and a horizontal resistance line above, forming a triangle. It is confirmed when it breaks the resistance line and continues the current trend.
- Descending triangle: Similar to the ascending triangle, but this forms in a downtrend and signals continued bearish momentum. It forms when a horizontal support line meets a descending trend line to form a triangle.
- Falling wedge: A wedge shape formed by two converging trend lines, confirmed with a close above the upper trend line.

Candlestick patterns focus on two or more candles, each representing the open, close, high, and low price in a given timeframe. They help technical analysts find optimum entry/exit points for short-term trading.
Examples of candlestick patterns:
- Hammer: Often appearing after a downtrend, this pattern shows a small body near the candle bottom and a long lower wick. It indicates a reversal.
- Shooting star: A small body near the bottom and a long upper wick, like an upside-down hammer. It indicates an imminent downtrend.
- Doji: Small or non-existent bodies with long upper/lower wicks, suggesting market uncertainty.

Using fundamental analysis to find trading opportunities
There are three main types of forex market analysis: technical, fundamental, and sentiment analysis.
Everything discussed above—historical data, charts, patterns, and indicators—comes under forex technical analysis.
A fundamental analysis moves away from charts and price action and focuses on data released by statistical agencies and central banks, including changes in interest rates, employment data, trade announcements, and GDP data, all of which can impact the value of global currencies and thus affect currency pairs.
It targets supply-and-demand factors that drive the currency’s underlying value.
For example, if Japan releases economic data that falls short of expectations—lower GDP growth, higher unemployment rates, and higher inflation—investors may respond by pulling their money out of Japanese investments, in which case we can expect significant changes in JPY currency pairs.
Fundamental analysis emphasizes market news that directly correlates with currency prices. Generally, positive economic forecasts strengthen a currency, while negative forecasts weaken it.
Remember, economies don’t exist in a vacuum. A country may announce key data every quarter or so, but traders have access to multiple tools and resources, giving them an approximate idea of what to expect.
If the UK announces slow GDP growth, it won’t send the pound sterling into freefall because the results and announcement were expected. Fundamental forex analysis, therefore, is about reacting to the unexpected:
Data | Announcement | Effect on currency |
GDP | Lower than expected | Negative |
Interest rates | Higher than expected | Positive |
Inflation | Lower than expected | Positive |
Unemployment figures | Higher than expected | Negative |

Finding trading opportunities with sentiment analysis
Market sentiment is playing an increasingly important role in forex trading analysis. It deals with how the markets “feel”, as that sentiment can predict future price action.
If you trade forex with a trusted broker like Exness, you can view the percentage of active long vs short positions. In the image below, for example, we see that for EURUSD, 62% are selling and 38% are buying.

Traders may deduce that sellers are beginning to take over, and will watch the market to determine how that ratio impacts the price. If selling pressure surpasses 70%, it indicates strong selling pressure and could signal a downtrend. On the other hand, if it surpasses 90%, they may open a “Buy” position, believing there are not enough sellers in the market to support that price action.
Trading glossary
Forex market analysis
Forex market analysis is the process of studying price data, economic indicators, and market sentiment to predict future currency movements. It helps traders make informed decisions about when to enter or exit trades.
Technical analysis
Technical analysis involves using historical price charts, patterns, and indicators to forecast future market behavior. It focuses on identifying trends, momentum, and potential reversal points.
Support and resistance
Support is a price level where buying pressure tends to prevent further declines, while resistance is where selling pressure limits upward movement. These levels help traders identify possible entry and exit zones.
Relative Strength Index (RSI)
The Relative Strength Index (RSI) is a momentum indicator that measures how overbought or oversold an asset is on a scale from 0 to 100. Traders use it to spot potential trend reversals and market exhaustion.
Candlestick pattern
A candlestick pattern is a formation created by one or more candles that reflects market psychology and price action. Common patterns, such as hammers and dojis, help traders predict short-term price movements.
Trend trading
Trend trading is a strategy where traders follow the dominant market direction and open positions in the same direction as the trend. It aims to profit from sustained price movements over time.
Fundamental analysis
Fundamental analysis evaluates economic data, central bank policies, and geopolitical events to determine a currency’s underlying value. It helps traders understand long-term market drivers beyond chart patterns.
Trade forex with an edge
Experience better-than-market conditions. Try live or demo.
Final thoughts
Forex chart analysis plays an important role in building an effective trading strategy by helping traders identify potential entry and exit points. By studying chart patterns and candlestick formations, traders can uncover high-probability trading opportunities. However, technical analysis is most effective when combined with fundamental and sentiment analysis to provide a more complete view of the market. Regardless of trading style, managing risk with stop loss and take profit orders remains essential for long-term success.
Before trading with real money, it’s highly recommended to practice your forex market analysis skills using a demo trading account. A demo account allows you to test strategies, explore chart tools, and build confidence in a risk-free environment, helping you refine your approach before entering the live market.
Frequently asked questions
What is the best type of forex market analysis for beginners?
Technical analysis is often the easiest starting point because it relies on visual charts and clear indicators. As experience grows, beginners should gradually combine it with fundamental and sentiment analysis.
How accurate is forex chart analysis in predicting price movements?
Forex chart analysis cannot predict prices with certainty, but it helps identify high-probability trading setups. Its effectiveness improves when combined with proper risk management and other analysis methods.
Can I rely only on technical analysis for forex trading?
While technical analysis is powerful, relying on it alone may expose traders to unexpected market news and volatility. Combining it with fundamental and sentiment analysis provides a more balanced trading approach.
Share:
Related


Exness Trade app
Trade with confidence anytime, anywhere.


Get the app
App title

Trading is risky. T&Cs apply.


