Average Directional Index strategy: How I use ADX to trade trends

Want to know when a trend is strong enough to trade? This guide to building your trading strategy using the Average Directional Index explains how to measure momentum and trade smarter.
My first few years of trading were spent trying to work out trends. I found it pretty easy to determine the direction the market was trending, but measuring the strength of the trend proved to be a lot more challenging.
Sometimes, I would jump into a trade only to watch the price stall or reverse because the trend lacked momentum, and other times, I would exit too early, missing what turned out to be a powerful run. It was bugging me, and it bugged me even more when I realised there was a way to quantify trend strength all along.
That’s when I came across the ADX—AKA, the Average Directional Index or Average Directional Movement Index—which is a tool specifically designed to measure the strength of a trend. Since adding it to my arsenal, it’s become my tool of choice, helping me filter out weak trends and stay patient during consolidations. More successful trades and far fewer costly mistakes.
Content
What is the Average Directional Index?
Let’s start with the basics. The ADX is a technical indicator developed by J. Welles Wilder in the 1970s to measure the strength of a trend, regardless of its direction.
Unlike other indicators that focus on predicting whether the price movement is going up or down, the ADX simply tells you whether a market is trending strongly, weakly, or not at all, which then helps you to decide whether to follow the trend or stay out of the market.
Make smarter trading decisions
Use expert analysis and tools on demo accounts or a live account.
It’s derived from two other lines: the +DI and the -DI. The +DI or Positive Directional Indicator measures the strength of upward price movement, while the -DI or Negative Directional Indicator measures the strength of downward movement.
The ADX itself is then calculated as a smoothed average of the difference between these two lines, producing a single value that reflects the overall trend strength, regardless of direction (see our momentum indicators guide). Here’s an example:

How do you use ADX in practice?
Once I worked out exactly what the ADX indicator was showing me, I wanted to know how to use ADX indicator data in practice. That started with learning to interpret trend thresholds before taking any trades.
The main rule I follow is simple: if the ADX is below 25, stay away. The reason for this is that readings under 25 indicate a weak or non-existent trend, meaning the market is likely moving sideways or lacking momentum.
Trading in these conditions can often lead to false breakouts and frustrating losses, especially if you’re trying to force a trade based solely on the direction. Any reading above 25, however, is far more encouraging.
A value between 25 and 40 indicates that the trend is strong, while a value above 40 indicates very strong momentum, meaning your trend-following strategies can be more aggressive – although you should watch out for potential exhaustion in this scenario. Reading these values is pretty simple as well. Here’s another example:


What are the best ADX settings?
As with any indicator, it helps to work with the right settings. The default for the ADX indicator is 14 periods, meaning it calculates trend strength based on the last 14 bars or candles.
For me, this offers the best balance between responsiveness and smoothing; it’s short enough to react to recent price action but long enough to filter out some of the market noise.
Some traders experiment with shorter periods, like seven or 10, for faster signals on intraday charts, but this can make the ADX more sensitive and prone to whipsaws. Conversely, longer periods, like 20 or 30, can smooth the line further, but this might delay signals for entering trades.
In my experience, sticking with the default works well across most timeframes and gives a reliable measure of trend strength without overcomplicating the analysis. However, the best ADX settings really depend on what kinds of trades you want to execute.
Day trading
For 5-minute, 15-minute, or 1-hour charts, you might shorten the ADX period to 7-10. This allows the indicator to react faster to short-term trends, but you should be prepared for more frequent false signals.
Swing trading
If you’re trading on daily or 4-hour charts, the standard 14-period ADX works well. You can even extend to 20 or 30 if you want a smoother line that filters out smaller fluctuations, just watch out for signals being delayed.
Scalpers
For very short-term trades, the best ADX settings are usually 5-7, which allows the indicator to react almost in real time to quick price movements. Again, these settings also increase the likelihood of false signals, which is why scalpers typically combine the ADX with price action or momentum indicators, which I’ll talk about later.
Long-term traders
If you’re holding positions for weeks or months, you might want to use a longer ADX period of 20-50, which focuses on sustained trends and helps to avoid overreacting to minor pullbacks. Even in this case, though, the default still works well, especially when combined with higher-timeframe analysis and other trend-confirming tools, like EMA or support and resistance levels. Again, I’ll talk about these later.
Algorithmic trading
Those who rely on automated systems might experiment with custom ADX periods tailored to the specific market or asset. If this is something you’re looking to do, I’d recommend demoing the settings first to ensure you can optimize the balance between responsiveness and noise without incurring losses due to false signals.
ADX strategy example: EURUSD trade walkthrough
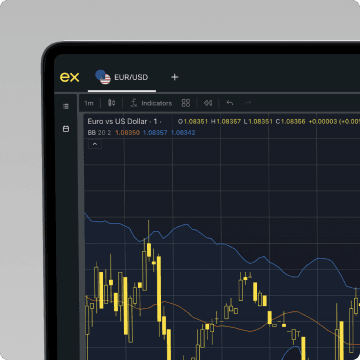
To give you an ADX strategy example, I’m gonna walk you through how I trade with ADX. As a day trader, EURUSD is one of my preferred markets, simply because it’s highly liquid and often develops clean, sustained moves that the ADX can pick up on.
Framing the bias on the 4-hour chart
The first thing I do is implement the 4-hour chart and watch for the ADX to rise through 25. This tells me that a trend is starting to strengthen, and the market is showing enough momentum to consider trading.
Dropping to the 1-hour chart
From there, I drop to the 1-hour chart to look for an entry, and wait for a pullback to a key level,, usually a prior resistance turned support or a retest of the 20-EMA.

Confirming the entry
If, at the same time, ADX hooks back above 25 and the +DI line remains above the -DI, that’s my cue to enter long. This ensures that I’m trading in the direction of the confirmed trend rather than against it.
Placing stop loss and targets
I’ll then place my stop loss just below the swing low and set my targets at the next resistance zone, helping to manage the risk while allowing room for the trend to develop.
Managing the trade
As the trade moves in my favour, I’ll continue to monitor the ADX, watching as it climbs into the 30s and 40s. I might also scale partial profits and trail my stop under higher swing lows or the 20-EMA to protect gains while letting the trade run.
Tips for trading with ADX effectively
That’s just one example of how to use ADX indicator data, but there are plenty of other factors I must consider to trade effectively.
Avoid low ADX markets
I always steer clear of markets where ADX is often below 25. Essentially, these periods always indicate weak or nonexistent trends, and trading during them often leads to false breakouts and losses.
Combine with other indicators
I also combine ADX with other technical indicators (see our guide to best indicators for day trading), such as the EMA mentioned above. Other indicators include RSI, which I use to measure the speed and change of price movements to identify oversold conditions, MACD, which I use to identify trend direction and momentum by comparing short-term and long-term moving averages, and the Stochastic Oscillator, which I use to spot potential reversal points when the market is overbought. I should note, however, that the indicators you use should be dictated by your own trading style and the market you’re trading.
Practice with demo
This can be worked out by practising with a demo. Before trying anything new, I always experiment with the strategy or indicator settings in a risk-free environment. I won’t do anything using a live trading account until I’ve built up my confidence and refined my approach.
Stick to your thresholds
I also make sure to stick to my thresholds. I only ever consider trades when ADX is above 25, and I tighten stops or scale out profits when it climbs above 40-50 to avoid getting caught in trend exhaustion.
Focus on ADX direction
Lastly, I think it’s important not only to watch the Average Directional Index level, but also its direction. This might sound a little obvious, but it’s so easy to get caught up in a high ADX number and assume the trend is continuing. Paying attention to both the value and the slope helps you stay in trades while momentum is building and exit before the trend loses steam, avoiding unnecessary losses and protecting the profits you’ve already made.
Is the ADX strategy right for you?
So there we have it. As I mentioned before, an ADX trading strategy can be incredibly useful if you want to identify strong trends as and when they happen, but that’s not to say it doesn’t have its pitfalls.
It’s important to note, for instance, that the ADX is calculated based on the moving averages of price range expansion over a given time, typically 14 periods. This means it reflects past price movements and lags slightly behind current market conditions.
In sideways or choppy markets, the ADX can also generate misleading signals, causing traders to think a new trend is starting when the market is merely experiencing volatility within a range.
However, with its strengths in mind —filtering out weak trends, clearly measuring momentum, and its versatility across timeframes —ADX can definitely be a powerful tool when used correctly.
Just make sure you practice before going live. For many people, using a demo account to get used to something like this can seem a little tedious, but it’s the best way to understand how ADX behaves in different market conditions and to gain confidence in your overall trade management. It’s also super easy and risk-free, so there’s nothing to lose from giving it a go.
Discover flexible conditions for day trading
Elevate your day trading strategy to the next level with low spreads and flexible leverage.
Key takeaways
- The Average Directional Index strategy measures trend strength. By using the ADX indicator, traders can filter out weak trends and focus on markets that are trending strongly.
- The ADX is a technical analysis tool built from directional movement indicators. It combines the Positive Directional Indicator (+DI) and Negative Directional Indicator (−DI) to indicate whether the price movement has strong momentum.
- ADX values below 25 signal a weak trend. Many traders avoid markets in this range because sideways movement often leads to false signals and losses.
- Rising ADX values confirm trend strength, while a falling ADX line warns of trend weakness. This helps technical analysts spot potential trend reversals and protect gains before momentum fades.
- The Average Directional Movement Index is lagging but reliable. Although it reflects past price range expansion, subsequent ADX values give clarity on whether a market trend is worth trading.
- The ADX strategy works best when combined with other technical analysis indicators. Pairing ADX with tools like moving averages, RSI, or the Stochastic Oscillator can confirm buy signals or sell signals in different market conditions.
- Adjusting ADX settings can refine any trading strategy. Shorter periods capture quick price moves for scalpers, while longer periods smooth out noise for swing traders and long-term trend trading systems.
Final thoughts on mastering ADX
Does it still surprise you that the Average Directional Index has become one of the most popular trading tools? For a while now, it’s been helping me with my trading strategy to focus on strong trends and find the right balance between entering trades at the right moment and avoiding weak markets, to the point where I can’t imagine trading without it. What was I doing before?
So give it a try if that’s something you’re interested in. However, remember, it might take a while to master. So, as long as you use those demos I mentioned and actually take the time to integrate them into your strategy effectively, I’m sure it’ll become just as powerful a part of your trading toolkit as it has become for me.
Share:
Related


Exness Trade app
Trade with confidence anytime, anywhere.


Get the app
App title

Trading is risky. T&Cs apply.


