
How to use Fibonacci Retracement levels to improve your trading


Curious how Fibonacci retracement levels can improve your trading? Learn how this tool identifies support and resistance zones for smarter entry and exit points.
Spotting support and resistance levels in trading can be achieved in quite a few different ways. Trendlines, moving averages, volume clusters—I’ve tried them all in my time. But I’ve found that one of the most effective—and reliable at pinpointing reversal zones, especially when the market is trending—has to be Fibonacci Retracement.
Content
- What is Fibonacci Retracement, and how does it work?
- How to use Fibonacci Retracement levels in practice
- What Fibonacci Retracement trading strategies are there?
- Tips for using Fibonacci Retracement effectively
- Fibonacci Retracement example
- Is Fibonacci Retracement right for your trading style?
- Key takeaways
- Final thoughts on mastering Fibonacci Retracement levels
What is Fibonacci Retracement, and how does it work?
For those unaware, Fibonacci Retracement levels refer to the indicator traders use to identify potential levels where a price may pause or reverse during a trend. It’s based on the Fibonacci sequence: 0, 1, 1, 2, 3, 5, 8, 13, 21, 34, 55, 89, 144, 233, and so on.
I know, I thought they were just random numbers at first, too. But actually, each new number is equal to the sum of the two preceding numbers. These ratios then create the Fibonacci levels used by traders: 23.6%, 38.2%, 61.8%, and 78.6%. Many traders also adjust their fib retracement settings to include levels like 50% or even 76.4%, depending on their strategy. Let’s take a quick look at it in action:

How to use Fibonacci Retracement levels in practice
As for how I use it in practice, the first step is identifying a clear trend. You want a move that is strong and visible, like my XAUUSD example, which went from 3,543 to 3,695. Once the trend is established, I draw the Fibonacci retracement from the start of the move—swing low—to the end of the move—swing high—for an uptrend. You can also draw it from high to low for a downtrend, but the key idea is the same: you’re trying to identify potential zones where price may pause or reverse as it retraces the original move.
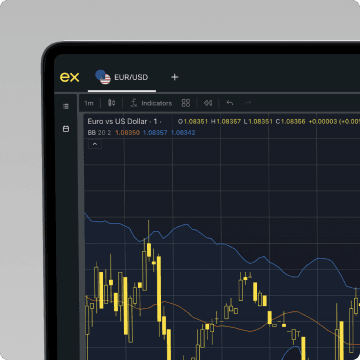
Look at the technical view
Execute your next move with confidence using a range of advanced technical indicators.
Identifying entry and exit signals
Once the Fibonacci retracement levels are plotted, I then observe how the price reacts near the main retracement levels, especially 61.8%, often called the fib retracement golden ratio, often called the fib retracement golden ratio, along with the 50% and 38.2% levels. By doing this, I can identify potential entry and exit points with far more confidence.
For instance, if the price approaches a key level, like 61.8%, and forms a bullish candlestick pattern, I know it might be a good opportunity to enter a long position. From there, I’d wait for it to hover around the 50% or 38.2% levels, and exit depending on how the trend unfolds.
Using Fibonacci Retracement levels in uptrends vs downtrends
The process for downtrends is essentially the reverse of an uptrend. Instead of drawing from low to high, I draw the retracement from the swing high to the swing low. How can I make a profit from doing this? I’m looking for areas where the price might temporarily pause or reverse.
This means waiting for the price to pull back up towards a key Fibonacci level, and then looking for a bearish signal to enter a short position. Don’t go in without figuring a way out: I plan my exit at previous swing lows or lower retracement levels, effectively selling near temporary resistance and aiming to profit as the trend continues downward.

What other indicators work well with Fibonacci Retracement?
Using it in isolation isn’t the most sensible strategy. If you’ve read our content on other tools and indicators, you’ll see this is a mantra for us and should be for you.
For me, Fibonacci retracement works best when combined with moving averages or trendlines, as they help confirm whether a retracement level is likely to hold or break.
For instance, if the price approaches a 61.8% retracement level and coincides with a rising moving average, the chance of a bounce increases. Similarly, in a downtrend, if the price retraces to a Fibonacci level and meets a descending trendline, that would strengthen my case for a short entry.
What Fibonacci Retracement trading strategies are there?
At its core, Fibonacci retracement can be used as the basis for typical strategies employed by a day trader, but the way in which it’s applied will vary depending on your trading style and time frame.
Forex strategies
This might involve a trend continuation trade in the forex market, where you wait for a currency pair to pull back to a key level. As I mentioned earlier, you will either be entering a long position in an uptrend or a short position in a downtrend, using other indicators to increase the reliability of your entry.

Crypto and indices strategies
In crypto and stock indices, the same principles apply, but these markets tend to be more volatile, meaning you should shift your strategy a little bit. Personally, I focus on shorter time frames and tighter risk management. For instance, in the bitcoin or ethereum markets, I watch for quick pullbacks to key levels like 38.2%, rather than waiting for a full 61.8% retracement. This helps me to be more agile and ready to adjust if the price breaks through a level unexpectedly.
Combining Fibonacci Retracement with moving averages or trendlines
Moving averages or trendlines are helpful to pull that off, and indeed, they should be constant companions no matter what strategy you’re going for. Whenever I trade, I always try to filter out false signals by only taking trades where multiple indicators agree. If I don’t do this, I’ll always be risking entering trades that look promising but fail because the broader trend or momentum doesn’t support them.
Tips for using Fibonacci Retracement effectively
The key to using Fibonacci retracement effectively is remembering that these are areas of interest, not exact price points where the market will always reverse. They highlight zones where price may pause, bounce, or encounter resistance, but confirmation from other indicators or price action is essential before making a trade.
Confirm with other tools
These other indicators could be moving averages or trendlines, but they also include RSI (Relative Strength Index), stochastic oscillators, volume analysis, or other similar tools. The bottom line is that you have other technical tools that increase the probability of a successful trade and help filter out those false signals.
Use multiple timeframes
Using multiple timeframes can also be a good way to get a clearer picture of the overall trend. For instance, you might identify the main trend on a daily chart and then switch to a 1-hour or 15-minute chart to see where the price is retracing and find a precise level to enter the trade. This will help you avoid trading against the larger trend and spot more precise entry points, rather than guessing based on a single timeline.
Practice first on a demo account
One other bit of advice I should mention is that it’s always best to practice in a risk-free environment. On the Exness demo account, you can draw Fibonacci retracement levels, experiment with timeframes, and test how the price reacts at key levels without actually risking any real money. By doing this, you can then build your confidence in identifying retracement levels and increase your chances of success when real money is involved.
Fibonacci Retracement example
If you’re still struggling to get an idea of how Fibonacci retracement can work as a whole, here’s a step-by-step walkthrough:
1. Identify the Trend
Start by looking at a higher timeframe, for instance, a 4-hour or daily chart, to determine the main trend. You can also confirm this trend with a 50-period EMA.
2. Draw Fibonacci Retracement
Identify the swing low and swing high, and draw the Fibonacci retracement from start to finish.
3. Check for confluence with other indicators
Use indicators like the RSI and Stochastic Oscillator to identify overbought or oversold signals, and to detect momentum shifts.
4. Switch to a lower timeframe
Move to a 1-hour or 15-minute chart to fine-tune your entry, and look for candlestick confirmation at the retracement level: hammer, engulfing, or pin bar in the direction of the trend.
5. Plan your trade
Enter at or just beyond the retracement level after confirmation, place just beyond the next Fibonacci level beyond your entry, and target the previous swing high or swing low to scale out at multiple retracement levels.
6. Monitor and adjust
Watch the price reaction. If it respects the retracement level and EMA, along with any other indicators, the trade is valid. If the price breaks the retracement level decisively, however, consider exiting early to limit risk.
All advice and suggestions are for educational purposes. There is no guarantee that the steps outlined in this article will result in successful or profitable trades, as conditions can change at any time. Trading is risky.

Is Fibonacci Retracement right for your trading style?
Whether Fibonacci retracement levels are right for your trading style depends on how you like to approach the market. For instance, there are key swing trader and scalper considerations. If you’re a scalper, it might be less reliable on very short timeframes because the price can move too quickly and erratically to respect the levels.
Conversely, for swing traders, it tends to be more effective because it highlights zones of interest over longer trends, allowing for more deliberate entries and exits. With the right strategy, you can gain a slight edge in timing and identifying high-probability zones. Just remember, there’s no guarantee that a price will halt at a retracement level, and it can be difficult to predict which level will trade off, hence the need for other indicators to support it.
Your trading toolkit matters
We offer advanced trading tools to enhance your efficiency and precision.
Key takeaways
- Fibonacci retracement levels help identify support and resistance zones. By applying Fibonacci retracements to swing highs and swing lows, traders can pinpoint potential support or resistance levels where the price may pause or reverse.
- The Fibonacci retracement tool is based on the Fibonacci sequence. This technical analysis tool uses ratios such as 23.6%, 38.2%, 50%, and the golden ratio of 61.8% to mark horizontal lines that highlight key retracement levels on a chart.
- Fibonacci retracements improve trading strategy in trending markets. When price moves strongly in one direction, drawing fib retracement lines helps traders find entry and exit points with a higher probability of success.
- The golden ratio at 61.8% is a critical Fibonacci resistance level. Many traders use Fibonacci retracement work around this level to confirm price action with candlestick patterns, treating it as a high-probability zone for reversals.
- Confluence with other technical analysis tools strengthens signals. Using moving averages, trend lines, or moving average convergence divergence (MACD) alongside Fibonacci retracement levels helps confirm signals and filter out false setups.
- Fibonacci retracements can be applied across different markets. Whether in forex, crypto, indices, or currency markets, the retracement tool remains a popular tool for identifying price points and planning profit targets.
- Fibonacci extensions can help set price targets. Beyond retracement levels, Fibonacci tools also project potential profit targets by extending price movements past swing points, useful for day trading or longer-term strategies.
- Market psychology plays a role in why Fibonacci tools work. Because many traders use Fibonacci retracements, the levels often become a self-fulfilling prophecy, creating predictable reactions at key levels in financial markets.
- Practicing with a charting platform helps refine Fibonacci strategies. By applying Fibonacci retracement lines on demo accounts, traders can test different market conditions, timeframes, and other indicators before trading with real money.
Final thoughts on mastering Fibonacci Retracement levels
Mastering Fibonacci retracement levels involves understanding that it's a tool for identifying potential zones of support and resistance, rather than a crystal ball for predicting exact price movements. For me, it required a lot of practice and patience, but using a demo account and taking my time with it was the perfect way to experiment and get to grips with each level. Since then, it’s been a mainstay on my trading charts, and I’m pretty sure the same will be true for you.
Share:
Related
Trading Pro Q&A: How do you validate support and resistance levels?
Trading Pro Q&A

Balancing fundamentals and technical analysis for forex
Expert opinions

Trading Pro Q&A: What market structure concepts do you rely on most, and why?
Trading Pro Q&A

Bitcoin technical analysis: Reading crypto's unique trends
Analysis

Exness Trade app
Trade with confidence anytime, anywhere.


Get the app
App title

Trading is risky. T&Cs apply.


