Ichimoku indicator trading strategy: Identifying buy and sell signals

Trading specialist Haikel Ali shares how he uses the Ichimoku indicator to read trend, momentum, and key support and resistance levels in a single glance. In this step-by-step Ichimoku trading strategy, he walks you through real examples of Ichimoku cloud buy and sell signals so you can apply the same approach in your own trades.
The Ichimoku cloud is a technical indicator that provides a snapshot of the general market trend. It might not be perfectly precise, but it’s a powerful tool to visualise support, resistance, and momentum at a glance.
What first grabbed my attention when I discovered this indicator was how much it revealed with so little effort. One tool, multiple insights—it’s almost the opposite of what most traders are taught. Most technical indicators force you to focus on just one aspect of the market, whether that’s trend direction, price momentum, or support and resistance levels. I used to stack three or four indicators on my chart just to feel confident enough to enter a trade, only to end up with more noise and second-guessing.
Using the Ichimoku indicator completely changed that for me. Instead of juggling different tools, it gave me a comprehensive view of price action within a single framework. I could see whether the trend was strong, where the key support or resistance zones were forming, and whether momentum was picking up or fading—all at once. The more I used it, the more I realised I didn’t need cluttered charts to make smart decisions. So how does it actually work in practice? Let’s break it down.
Content
- What is the Ichimoku indicator, and how does it work?
- Breaking down the Ichimoku components
- How the Ichimoku indicator generates trading signals
- How I use the Ichimoku indicator in practice
- Ichimoku vs other trading indicators
- Example trade walkthrough: Ichimoku strategy in action
- Tips for mastering the Ichimoku indicator
- Is the Ichimoku strategy right for you?
- Final thoughts on Ichimoku trading signals
Key takeaways
- Ichimoku offers a complete view of market trends at a glance. Unlike most technical indicators, the Ichimoku cloud system provides trend direction, support and resistance levels, and momentum in one tool, making it a true one glance equilibrium chart.
- Each Ichimoku component contributes to powerful trading signals. Lines like the conversion line (Tenkan-sen), base line (Kijun-sen), lagging span (Chikou Span), and leading spans (Senkou Span A & B) work together to confirm bullish signals, sell signals, and shifts in market sentiment.
- Cloud thickness and cloud boundaries help identify the strength of the trend. A thick Kumo cloud suggests strong support or resistance, while a thin cloud may allow price breaks and potential trend reversals, helping traders evaluate future price movement.
- Bullish and bearish signals rely on alignment, not a single crossover. A reliable Ichimoku cloud trading strategy requires multiple confirmations, such as price above the cloud, the conversion line crossing above the base line, and the Chikou Span positioned above past price action.
- Ichimoku works best in trending markets, not choppy ranges. This comprehensive indicator excels in trending markets with clear momentum but can produce false signals in sideways financial markets, meaning traders should confirm the direction before entering a position.
Make smarter trading decisions
Use expert analysis and tools on demo accounts or a live account.
What is the Ichimoku indicator, and how does it work?
When translated, “Ichimoku Kinko Hyo” can be interpreted as “one glance equilibrium chart.’ This means it’s a technical analysis tool that provides a broad view of the market, including support and resistance, momentum strength, trend direction, and potential signals.
Because it’s so comprehensive, it filters out a lot of noise, making it easier for traders to identify overall market trends and potential trading opportunities without constantly second-guessing price movements—just as analysts using a comprehensive view of trend, momentum, and market strength with Ichimoku would recommend.

As for how it works, the indicator combines five distinct components that work together to signal potential entry and exit points. These include the conversion line, the baseline, the leading span A and B, and the lagging line. Let’s take a look in more detail.
Breaking down the Ichimoku components
Developed in the 1930s by Japanese journalist and technical analyst, Goichi Hosoda, the first thing you’ll notice is that each Ichimoku component is identified by its original Japanese name. Now, I’m not fluent in Japanese, so this seemed a little complex at first. However, it only took me a short amount of time to realise that each component fits the language I’d already come to know in the trading world.
Tenkan-sen (Conversion line)
Tenkan-sen is the conversion line, similar to a moving average. This is a short-term trend gauge, calculated as the midpoint of the highest high and the lowest low over the previous nine periods.

Kijun-sen (Base line)
Kijun-sen stands for “base line,” which is a longer-term trend indicator. It is calculated as the midpoint of the highest high and lowest low over the previous 26 periods.

Senkou Span A & B (Kumo or “cloud”)
Senkou Span A & B are the two lines that form the famous Kumo, or “cloud.” The space between these lines is crucial, as they highlight key support and resistance zones, as well as the overall trend direction. By observing this, we’re getting clear Ichimoku cloud buy and sell signals, making it a key indicator for future projection.

Chikou Span (Lagging Line)
Lastly, we have the Chikou Span, which translates to “lagging line”. By comparing current vs past price action, this indicator confirms trend strength and helps validate potential entry or exit points by showing whether the current trend aligns with historical price movements.

How the Ichimoku indicator generates trading signals
As for how the Ichimoku indicator generates trading signals, it’s all about the interaction between each line and the position of the price relative to the cloud. By observing crossovers, cloud breaks, and the alignment of the Chikou Span with the price, you can get a far better idea of how the market is trending and, as a result, identify your entry and exit points.
Bullish signals
One of the simplest and most common signals, for instance, comes from the interaction between the conversion line and the base line. When the Tenkan-sen is above the Kijun-sen, it indicates upward momentum, suggesting a potential buying opportunity.
Likewise, when the price breaks above the Kumo, and the Chikou Span is above the price, these are also strong bullish confirmations that indicate a high probability of an upward trend. Here’s another example:

Bearish signals
When the conversion line is below the base line, this indicates downward momentum, which means you should be cautious about entering long positions. Likewise, the price breaking below the Kumo, and the Chikou Span being below the price are all bearish signals that suggest the downward trend may continue.

Neutral or consolidation phases
There are also neutral or consolidation phases to be aware of. For example, when the price is inside the Kumo, it signals market indecision. This means neither bulls nor bears are in full control, and traders may want to wait for a clear breakout above or below the cloud before taking a position.
On the other hand, when there’s a cloud twist, it suggests future range-bound action, indicating that the market may consolidate or trade sideways before a more decisive trend emerges.

How I use the Ichimoku indicator in practice
This all might seem like a lot to keep in mind, but actually, once you get the hang of what each line represents and how they interact, it becomes relatively simple to use them in practice. Personally, I start by trying to identify trend directions, and then use specific components of the Ichimoku to confirm momentum shifts and refine my entry point.
Identifying trend direction at a glance
By simply looking at the cloud, I can get an instant bias: if the price is above the Kumo, the market is generally bullish, whereas if it’s below, the market is probably bearish. The thicker the cloud, the stronger the support or resistance zone it represents, giving me an easy snapshot of market sentiment at a glance.
Filtering false breakouts
I then work on filtering false breakouts. Markets are full of these—prices briefly breaking a key level before snapping back. However, with the Ichimoku, instead of acting on a single breakout, I can wait for confirmation across multiple signals. For instance, a bullish cloud breakout becomes much more reliable if the Chikou Span is also above the price and aligned with the trend.
Timing entries and exits
In terms of my entry, I often wait for the Tenkan-sen to cross above the Kijun-sen while the price is also trading above the cloud. That way, I’m aligning short-term momentum with the broader market trend. For my exits, I’m waiting for the price to fall back into the cloud, signalling weakening momentum or the start of consolidation.
Ichimoku vs other trading indicators
As for why I think it stands out above other trading indicators, it’s all about the holistic view it provides. Instead of needing multiple separate tools for trend, momentum, and support and resistance, Ichimoku combines them all into one system. But that’s not to say that you don’t need any other indicator other than Ichimoku. On the contrary, each indicator can have its own unique strengths. Additionally, combining indicators with chart patterns as part of technical analysis can improve the reliability of your entries and exits.
Indicator | Strength | Weakness | Best use case |
Ichimoku | Provides a holistic view of the market and reduces the need for multiple separate indicators. | Not ideal for short-term scalping, and can seem complex to beginners. | Spotting overall trend direction, confirming entries and exits, and filtering false signals. |
RSI | Simple and easy to interpret, and good for momentum. | Works best in ranges, and can generate false signals in trending markets. | Identifying momentum shifts and potential reversals. |
MACD | Also beneficial for momentum and useful for identifying divergences that can signal trend reversals. | Lags behind the price, making it less effective in choppy markets. | Confirming trend strength and momentum in trending markets. |
Bollinger Bands | Visualises volatility, helping to identify overextended moves and squeezes. | Less effective without other confirmation. | Spotting volatility breakouts and potential entry and exit zones. |
Example trade walkthrough: Ichimoku strategy in action
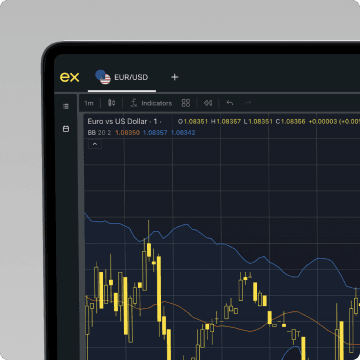
So let’s look at an Ichimoku trading strategy in action. In this example, I’ll be using a 1-hour EURUSD chart, with only the Ichimoku indicator for ease of visualising the trend without any clutter.
- Entry: Tenkan-Kijun cross above Kijun-sen
My entry would be when the Tenkan-Kijun crosses above the Kijun-sen, while the price is trading above the Kumo. This alignment signals bullish momentum in the direction of the overall trend, increasing my probability of a successful trade.

To manage risk, I’ll also place my stop loss just below the Kijun-sen or below the bottom of the cloud, depending on market volatility. This ensures that if the trend fails, losses are limited while still allowing the trade enough room to breathe.
- Exit: Chikou Span crossing below the price or cloud twist
For exiting the trade, I’ll watch for the Chikou Span to cross below the price or for a cloud twist to signal a potential trend reversal. Either of these provides a clear warning that momentum may be weakening.

Tips for mastering the Ichimoku indicator
That’s a simple Ichimoku trading strategy to try, but there are a few things to bear in mind before you do so. I’ve laid them out in bullet points for quick reference and ease of understanding, especially for beginners looking to apply the indicator in their upcoming trades:
- Always zoom out to see the full picture.
- Cloud is the most powerful on higher timeframes.
- Combine Ichimoku with volume or RSI for confirmation.
- Avoid overcomplication.
- Practice on a demo account before live trading.
Look at the technical view
Execute your next move with confidence using a range of advanced technical indicators.
Is the Ichimoku strategy right for you?
If you are a beginner, consider whether the Ikimoku indicator is really right for you. In my opinion, it’s incredibly useful for swing and position traders, but if you’re a scalper, you might find it too slow. I’ve also found that it works well in trending markets, but not as well in choppy ranges, where it tends to be less reliable. That being said, if you’re a trader exploring different forex strategies and looking for a holistic indicator, you’re unlikely to find any single tool that gives a more complete view of trend, momentum, and support and resistance as Ichimoku does.
Trading glossary
- Ichimoku Kinko Hyo (Ichimoku indicator): A technical analysis tool meaning “one glance equilibrium chart”, designed to show trend direction, support, resistance, and momentum all in one view.
- Tenkan-sen (Conversion line): A faster-moving boundary calculated as the midpoint of the highest high and lowest low over the last nine periods. It is used to gauge short-term momentum and early buy or sell signals.
- Kijun-sen (Base line): A slower trend measure similar to a moving average, calculated over 26 periods. It helps to confirm trend strength and acts as dynamic support or resistance in an Ichimoku cloud trading strategy.
- Senkou Span A & B (Kumo or “cloud”): The two projected lines that create the Ichimoku or “cloud”, forming future support and resistance zones. A cloud breakout above or below these spans often shows strong bullish or bearish signals.
- Chikou Span (Lagging span): A line plotted using the current period’s closing price but shifted 26 periods into the past to confirm whether the current market trend aligns with historical price action.
Final thoughts on Ichimoku trading signals
Put simply, I use Ichimoku as a one-glance tool for trend, momentum, and support and resistance, which makes it a powerful addition to my trading toolkit. That said, I always remind myself to look for confluence. Before I take anything live, I also ensure that I practice spotting this confluence in a risk-free demo trading environment first. By doing so, I build confidence and greatly reduce the risk of making costly mistakes when I’m trading with real money.
Share:
Related


Exness Trade app
Trade with confidence anytime, anywhere.


Get the app
App title

Trading is risky. T&Cs apply.


